eofigs
Analysis-aware, publication-ready figures for Earth observation research.
eofigs turns Earth observation analysis outputs (rasters, time series, validation pairs) into journal-ready figures that know the analysis, the variable and the printed size.
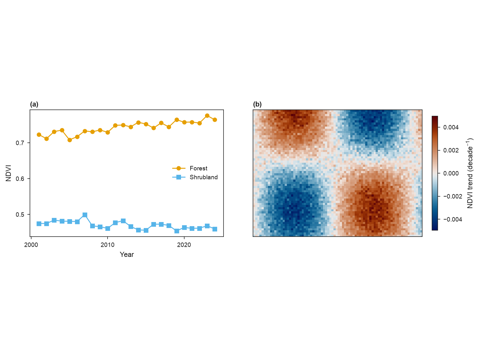
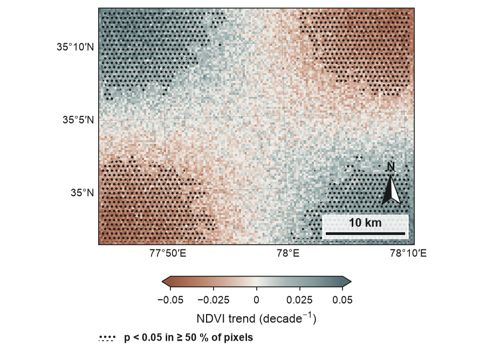
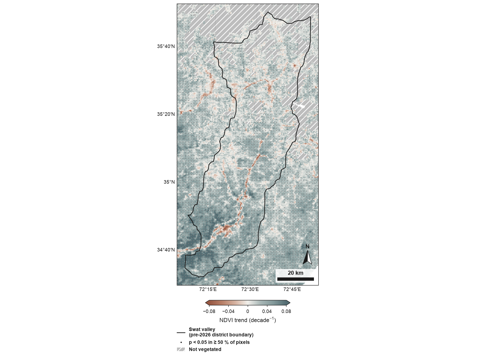
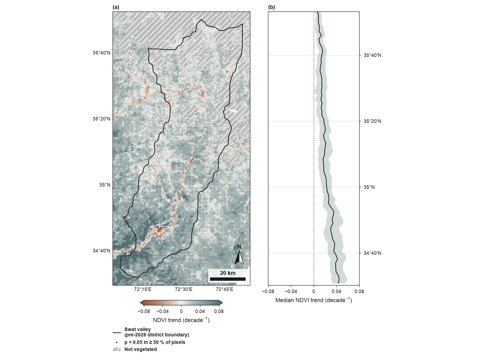
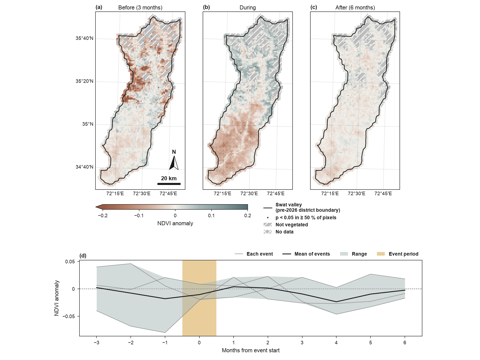
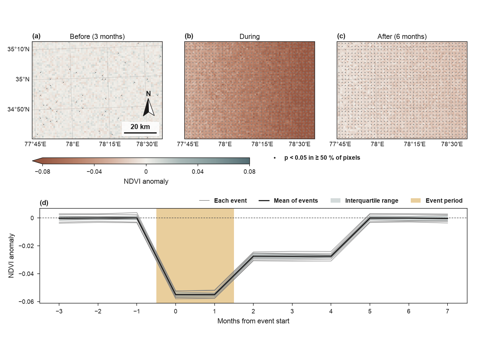
- Recipe figures for common analyses: trend with significance, event composites, and later recovery, burn severity, disturbance and divergence.
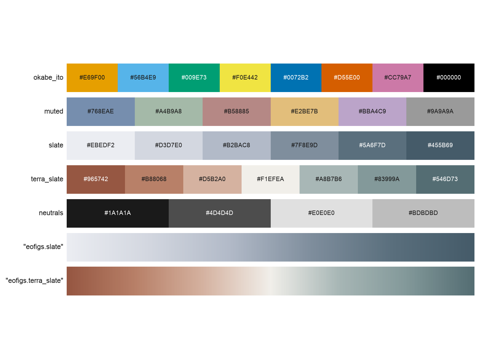
- A variable library with fixed colour maps, symbols and units.
- Print-size rendering: rasters are reduced to the pixels the printed figure needs, from its width in mm and its dpi.
- Journal presets and one-call export to vector PDF plus 600 dpi PNG or TIFF, with a figure check.
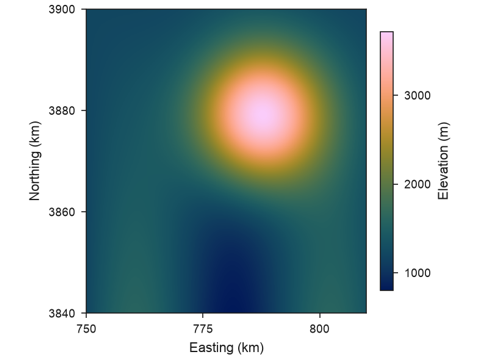
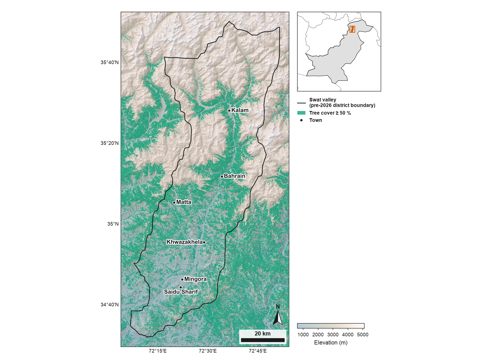
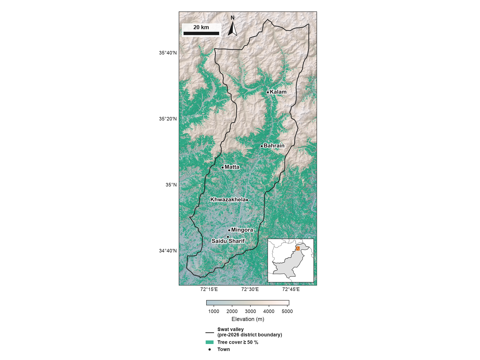
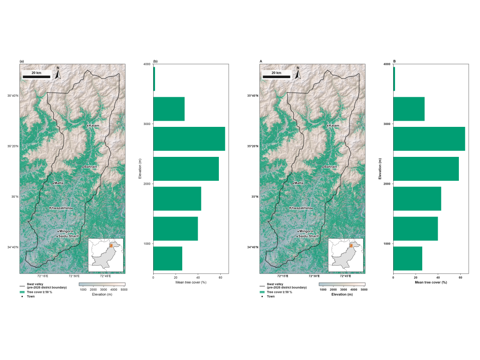
Start with the Installation and the Quickstart; worked examples with real data are in the Gallery.
Gallery
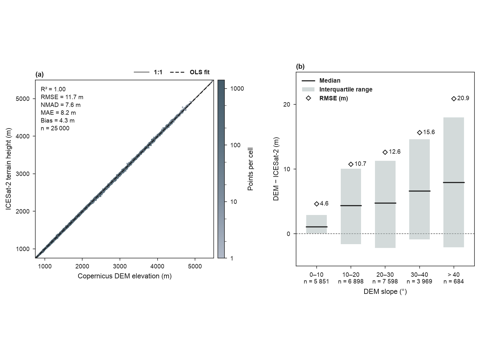
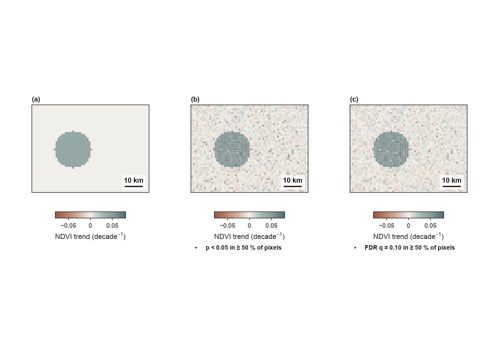
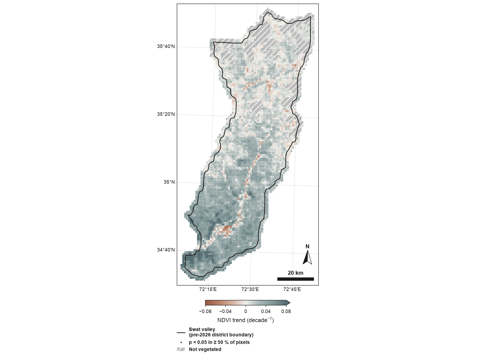
Roadmap
| Version | Content |
|---|---|
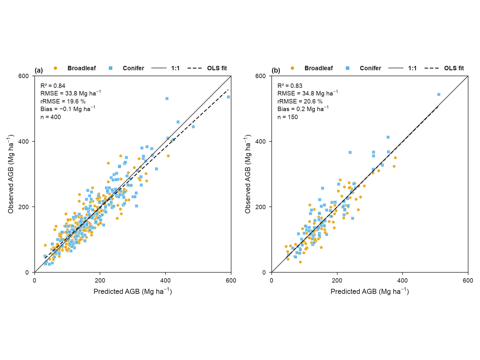
| v0.1 | Journal styles and export, figure check, figure set, variable library, print-size raster handling, trend statistics; study area map, trend map, event composite and accuracy scatter recipes |
| v0.2 | False discovery rate control of significance marks; seasonal Mann–Kendall test |
| Planned | Burn severity, recovery, disturbance and divergence recipes; SHAP and partial dependence styling; confusion matrix; Google Earth Engine input through Xee; R package with matching function names, after the Python API is stable |