Significance with false discovery rate control
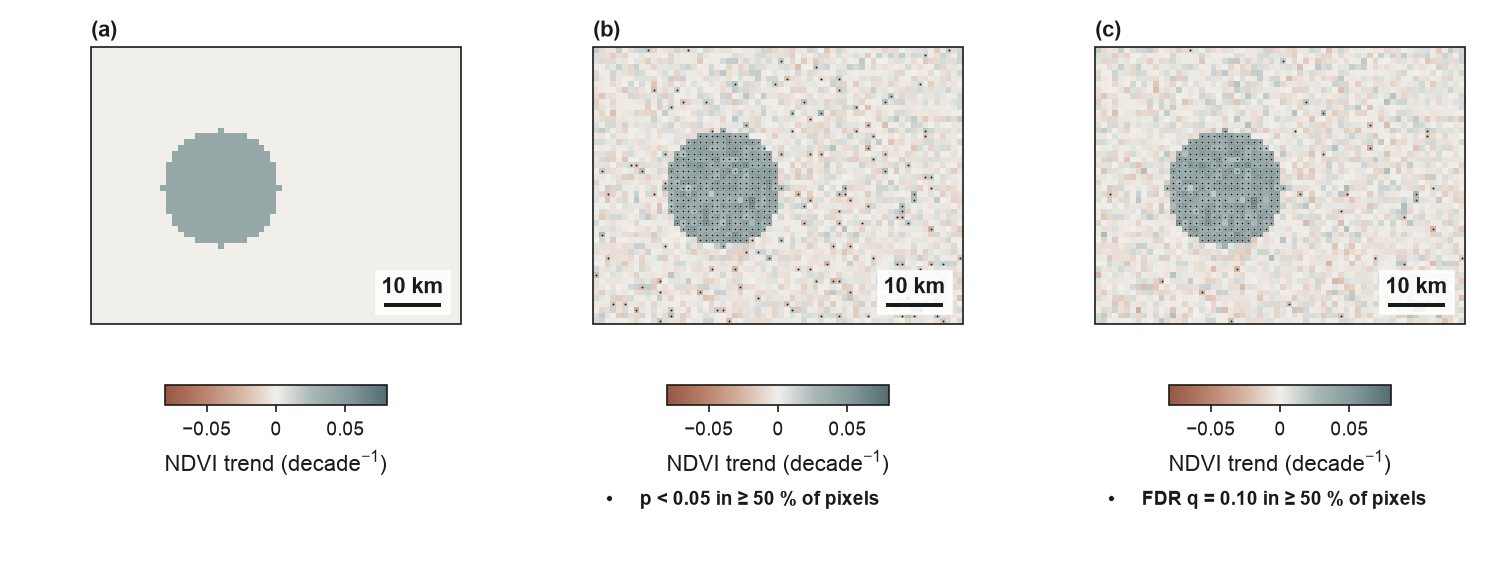
A synthetic field with a known answer: 20 annual NDVI values for 48 × 64 pixels of 1 km, a trend of 0.04 per decade in a disc of 317 pixels (10.3 %) and none in the other 2 755, noise 0.02. (a) The true trend. (b) Theil–Sen trend with dots where each pixel's Mann–Kendall test gives p < 0.05, not adjusted for multiple comparisons: 445 pixels marked, 314 of the 317 with a trend and 131 of the 2 755 without (4.8 %), so 29.4 % of the marks are false. (c) The same trend with Benjamini–Hochberg false discovery rate control at q = 0.10 (fdr="bh", the default q = 2 × alpha; Wilks 2016) over the 3 072 pixels, equivalent to p ≤ 0.010: 330 pixels marked, 302 of the 317 with a trend and 28 without (1.0 %), so 8.5 % of the marks are false. One dot per pixel (dot_spacing_mm set to the pixel size). In a field where most pixels have a trend the same q can be less strict than p < 0.05; see the trend map page. Synthetic data.
import numpy as np
import pandas as pd
import rioxarray  # noqa: F401
import xarray as xr

import eofigs
from eofigs.stats import fdr_mask

ROWS, COLS, YEARS, CELL = 48, 64, 20, 1000.0
rng = np.random.default_rng(42)
yy, xx = np.mgrid[0:ROWS, 0:COLS]
truth = (yy - 24) ** 2 + (xx - 22) ** 2 <= 10**2  # the pixels with a trend
true_slope = np.where(truth, 0.04, 0.0)  # NDVI per decade
time = pd.date_range("2001-01-01", periods=YEARS, freq="YS")
years = np.arange(YEARS)[:, None, None]
values = rng.normal(0.5, 0.02, (YEARS, ROWS, COLS)) + true_slope[None] / 10 * years
coords = {
    "y": 3_900_000 - (np.arange(ROWS) + 0.5) * CELL,
    "x": 500_000 + (np.arange(COLS) + 0.5) * CELL,
}
cube = xr.DataArray(values, dims=("time", "y", "x"), coords={"time": time, **coords})
cube = cube.rename("ndvi").rio.write_crs("EPSG:32643")
cube.attrs = {"long_name": "NDVI", "units": "1"}
truth_map = xr.DataArray(true_slope, dims=("y", "x"), coords=coords, name="ndvi")
truth_map = truth_map.rio.write_crs("EPSG:32643")

eofigs.set_style("elsevier", max_ticks=3)
fig, ax0 = eofigs.new_figure("double", height_mm=72, layout="none")
ax0.remove()
panels = fig.subfigures(1, 3)
common = {
    "variable": "ndvi",
    "limits": 0.08,
    "exclude": None,
    "dot_spacing_mm": 0.75,  # about one pixel: every significant pixel gets its dot
    "graticule": False,
    "north_arrow": False,
}
eofigs.trend_map(slope=truth_map, subfigure=panels[0], **common)  # (a) the truth
eofigs.trend_map(cube, subfigure=panels[1], **common)  # (b) p < 0.05 per pixel
eofigs.trend_map(cube, subfigure=panels[2], fdr="bh", **common)  # (c) FDR at q = 0.10
eofigs.label_panels([panel.axes[0] for panel in panels])


# README card: the edge of the disc and the noise beside it, in (b) and (c)
readme_card = [
    {"items": [(panel.axes[0], (0.30, 0.07, 0.75, 0.93))], "label": label}
    for panel, label in ((panels[1], "p < 0.05"), (panels[2], "FDR q = 0.10"))
]

if __name__ == "__main__":
    p = eofigs.trend(cube).pvalue.values
    for name, marked in (("p < 0.05", p < 0.05), ("FDR q = 0.10", fdr_mask(p, q=0.10).mask)):
        kept, false = int((marked & truth).sum()), int((marked & ~truth).sum())
        print(f"{name}: {marked.sum()} marked, {kept} of {truth.sum()} true, {false} false "
              f"({100 * false / marked.sum():.1f} % of the marks)")  # fmt: skip
    print(eofigs.save_figure(fig, "fdr_synthetic"))
Figure check
Figure check (elsevier): passed
  PASS  size: 190.0 x 72.0 mm (double width).
  PASS  resolution: 600 dpi (at least 500 for figures with text and images).
  PASS  font size: Smallest text 7 pt (minimum 7 pt).
  PASS  fonts: Fonts in use: Arial.
  PASS  colour-blind safety: Fewer than two categorical colours.
  PASS  colour maps: Colour maps: eofigs.terra_slate (diverging).
  PASS  ticks: At most 3 tick labels per axis.