Colours
Built-in palettes
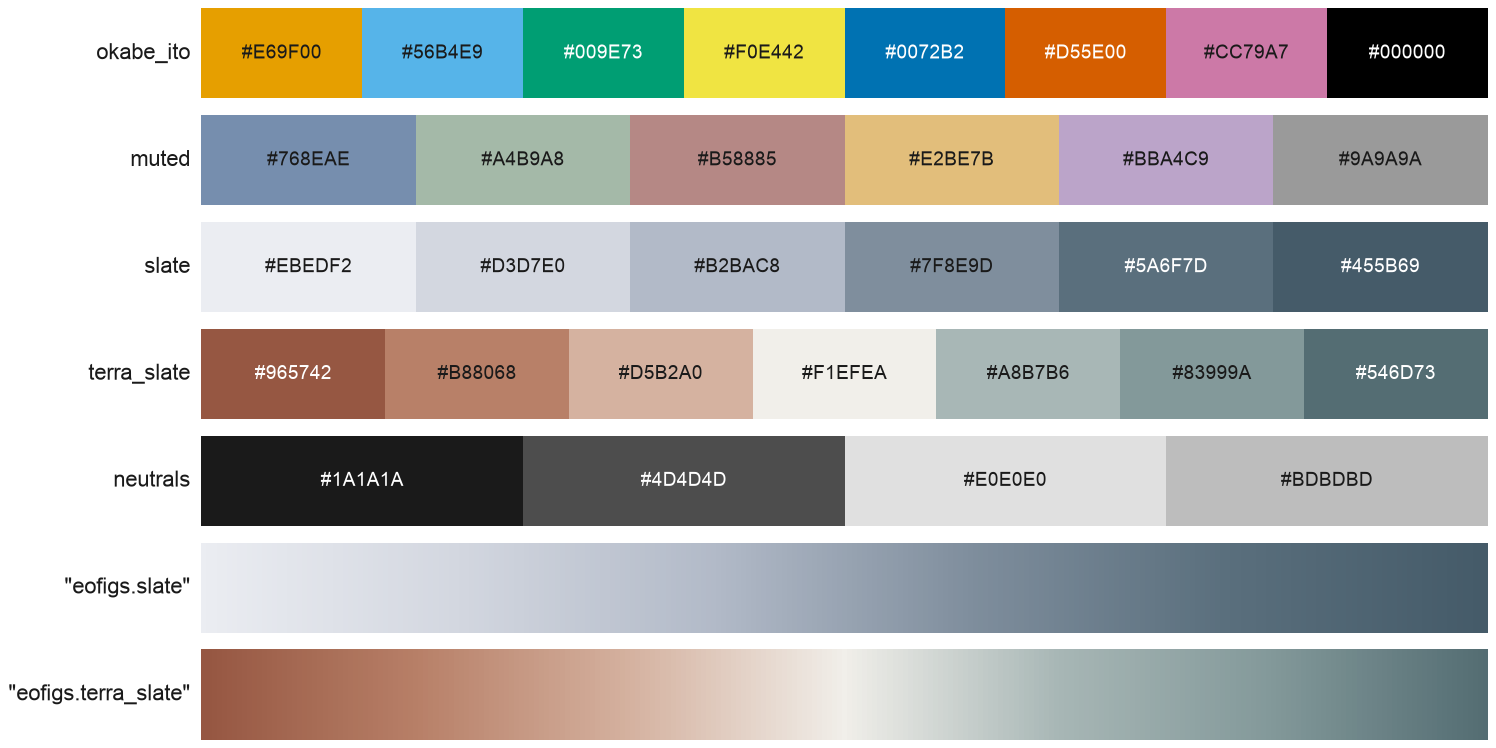
eofigs.palettes holds colour palettes for the common jobs in a figure:
| Palette | Use | Colours |
|---|---|---|
okabe_ito |
lines, points, error bars, small symbols (Okabe & Ito 2008) | #E69F00, #56B4E9, #009E73, #F0E442, #0072B2, #D55E00, #CC79A7, #000000 |
muted |
filled areas: bars, stacked areas, class maps with up to five classes; grey for "other" | #768EAE, #A4B9A8, #B58885, #E2BE7B, #BBA4C9, #9A9A9A |
slate |
ordered magnitude in a few classes, light (low) to dark (high) | #EBEDF2, #D3D7E0, #B2BAC8, #7F8E9D, #5A6F7D, #455B69 |
terra_slate |
signed values around zero: terracotta (negative), off-white (zero), slate teal (positive) | #965742, #B88068, #D5B2A0, #F1EFEA, #A8B7B6, #83999A, #546D73 |
neutrals |
text and axes, secondary lines, grid lines, no-data areas | #1A1A1A, #4D4D4D, #E0E0E0, #BDBDBD |
from eofigs import palettes

ax.bar(classes, areas, color=palettes.muted[:4])
ax.imshow(anomaly, cmap="eofigs.terra_slate", vmin=-limit, vmax=limit)
slate and terra_slate are registered as matplotlib colour maps ("eofigs.slate",
"eofigs.terra_slate", and "_r" for the reversed maps) when eofigs is imported. Both
pass eofigs' own colour-map check: lightness changes monotonically along slate, and on
each side of the off-white centre of terra_slate, which sits exactly at zero when the
colour limits are symmetric. Masked values are drawn in the no-data grey #BDBDBD.
Variables in the variable library keep their own continuous colour maps (cmcrameri), and these palettes complement them.
Colour-blind safety
check_figure compares every pair of categorical colours (lines, markers, bars, fills)
with CIEDE2000:
| View | Warning below |
|---|---|
| Normal vision | 10 |
| Protan, deutan, tritan (Machado et al. 2009, full severity) | 6 |
A close pair is a warning, not a failure: series that also differ by marker, line style or a direct label stay distinguishable.
Preview
cvd_preview writes one image with five panels: normal vision, protan, deutan and tritan
simulation, and greyscale (CIELAB lightness).
eofigs.cvd_preview(fig, "fig3_cvd.png")  # a live figure
eofigs.cvd_preview("figures/fig3.png")  # an exported file -> figures/fig3_cvd.png
Check that every series, class and colour-map step is still distinguishable in each panel, and that sequential data keep their order in the greyscale panel.