Trends
trend computes a Theil–Sen slope and a Mann–Kendall test for every pixel of a time series
cube, against the real dates.
import eofigs

result = eofigs.trend(ndvi_cube, per="decade")  # time, y, x -> y, x
result.slope  # NDVI per decade
result.significant  # p < 0.05
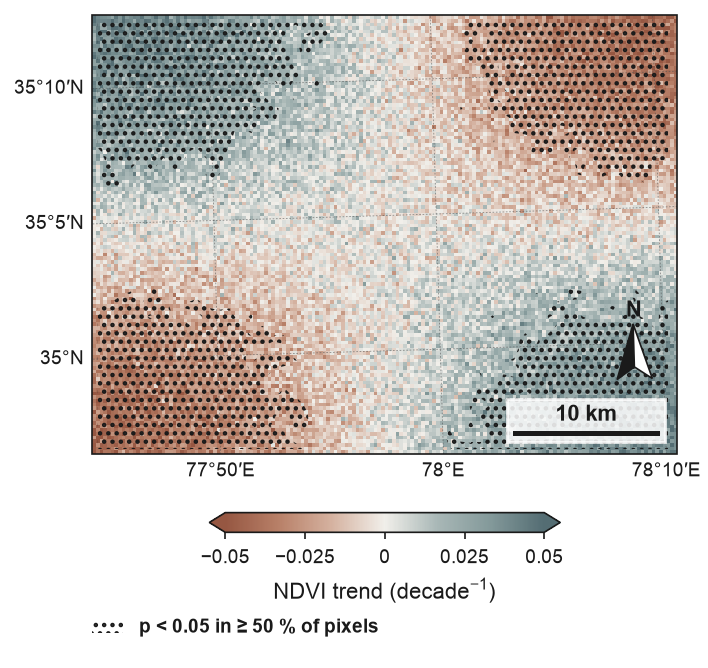
The figure shows a synthetic annual NDVI series (2000–2024) with greening and browning
regions and noise, drawn with trend_map: the Theil–Sen slope with the
library's vegetation trend colours, and hatching where the Mann–Kendall test gives
p < 0.05 for at least half of the pixels in each cell. The full script is on the
gallery page.
Output
| Variable | Meaning |
|---|---|
slope |
median of all pairwise slopes, in data units per per ("decade" or "year") |
intercept |
median of y - slope * t: the value at the first date, stored in its reference_time attribute |
pvalue |
two-sided Mann–Kendall p-value |
significant |
pvalue < alpha (default 0.05) |
n_valid |
number of valid observations |
Pixels with fewer than min_valid observations (default 8) are NaN. Spatial coordinates
and the CRS are kept, so the result plots directly as a map. The slope is labelled as a trend
of the input variable (for NDVI: "Normalized Difference Vegetation Index trend",
decade$^{-1}$), so eofigs.variable(result.slope) returns the variable's trend with
zero-centred colours.
Method and assumptions
- Time: slopes use the datetime coordinate converted to years, so gaps and irregular steps are handled. A time axis that is not datetime64 raises an error.
- Theil–Sen slope (Sen 1968) and intercept as in
scipy.stats.theilslopes(method="joint"); the tests compare both with SciPy for every pixel. - Mann–Kendall test (Mann 1945; Kendall 1975) with the tie correction of the variance and the continuity correction of Z.
- Assumptions: observations are treated as serially independent; no correction for autocorrelation (modified Mann–Kendall, prewhitening) is applied. For monthly or other sub-annual data use the seasonal test below, or aggregate to annual values first.
Seasonal data
A seasonal cycle distorts the plain Mann–Kendall test and the Theil–Sen slope of monthly
data: most pairs of values compare different times of the year. seasonal="month" uses the
seasonal Mann–Kendall test and the seasonal Kendall slope (Hirsch et al. 1982) instead: each
month is compared only with the same month in other years, and the statistics are summed
over the months.
result = eofigs.trend(monthly_ndvi, seasonal="month")  # 12 calendar months
growing = monthly_ndvi.sel(time=monthly_ndvi.time.dt.month.isin([5, 6, 7, 8, 9]))
result = eofigs.trend(growing, seasonal="month")  # May to September only: 5 seasons
result.attrs["seasonal_correction"]  # 'Hirsch-Slack 1984'
- Seasons:
"month"(the calendar month of each date), or an array with one label per time step for other periods. For 16- or 8-day composites, label each value by its composite, for example its day of year:seasonal=composites.time.dt.dayofyear.values. Each season may have one value per calendar year; more than one raises an error that names the season and year (resample, for example to monthly means, or use finer labels). Seasons with fewer than 4 values in a pixel are left out of its test, as in the R package rkt. - Correlation between seasons: values of consecutive months of one year usually move
together, which makes the seasonal test too willing to find a trend. By default the
variance of the test statistic includes the covariances between seasons (Hirsch and Slack
1984; the same computation as
rkt(..., correct = TRUE)). The correction needs at least 10 complete years; with fewer, the uncorrected test is used with aTrendWarning, andtrend_map's caption says so. A complete year is a calendar year in which the time axis has a step for every season, so the count is the same for every pixel; gaps within a pixel are handled by mean ranks and by leaving out seasons with fewer than 4 values.seasonal_correction=Falsetreats the seasons as independent. - Without
seasonal, sub-annual data (median step under 300 days) get aTrendWarningsuggestingseasonal="month";seasonal="none"keeps the plain test and states the choice. - Checked against R: the tests compare S, the variances with and without the
correction, the p-values and the slope with
trend::smk.test,trend::csmk.test,trend::sea.sens.slopeandrkt::rkt(script:docs/scripts/seasonal_mk_reference.R).
The seasonal trend map of Swat monthly NDVI shows the effect of the correction: 59.6 % of the vegetated pixels are significant with it, 63.4 % without.
Hirsch, R. M., Slack, J. R., & Smith, R. A. (1982). Techniques of trend analysis for monthly water quality data. Water Resources Research, 18(1), 107–121. doi:10.1029/WR018i001p00107
Hirsch, R. M., & Slack, J. R. (1984). A nonparametric trend test for seasonal data with serial dependence. Water Resources Research, 20(6), 727–732. doi:10.1029/WR020i006p00727
Memory and time
The pairwise slopes are processed in blocks of pixels that fit memory_mb (default 256 MB),
so any series length works. The work grows with the number of pairs, n(n−1)/2, per pixel:
| Series | Pixels | One core | dask, 32 threads |
|---|---|---|---|
| 300 monthly steps | 20 000 | 37 s | 7.6 s |
| 300 monthly steps | 1 000 000 (extrapolated) | about 30 min | about 6 min |
Peak memory stayed near 400 MB for every size. For large cubes pass a dask-backed array
(for example cube.chunk({"x": 500, "y": 500})); the blocks then run in parallel. Annual
series are much faster: 25 steps have 300 pairs instead of 44 850. For long monthly series,
use the seasonal test (see Seasonal data) or aggregate to annual values.
References
- Sen, P. K. (1968). Estimates of the regression coefficient based on Kendall's tau. Journal of the American Statistical Association, 63, 1379–1389.
- Mann, H. B. (1945). Nonparametric tests against trend. Econometrica, 13, 245–259.
- Kendall, M. G. (1975). Rank Correlation Methods. Griffin, London.