Accuracy scatters
accuracy_scatter draws the standard validation figure: estimates against reference values
with the 1:1 line, a fitted line and a box of statistics, with labels and units from the
variable library.
import eofigs

eofigs.set_style("elsevier")
fig = eofigs.accuracy_scatter(field_agb, predicted_agb, variable="agb")
print(fig.eofigs_layout["stats"])  # every statistic at full precision
print(fig.eofigs_layout["caption"])  # definitions, fitted line, density rule
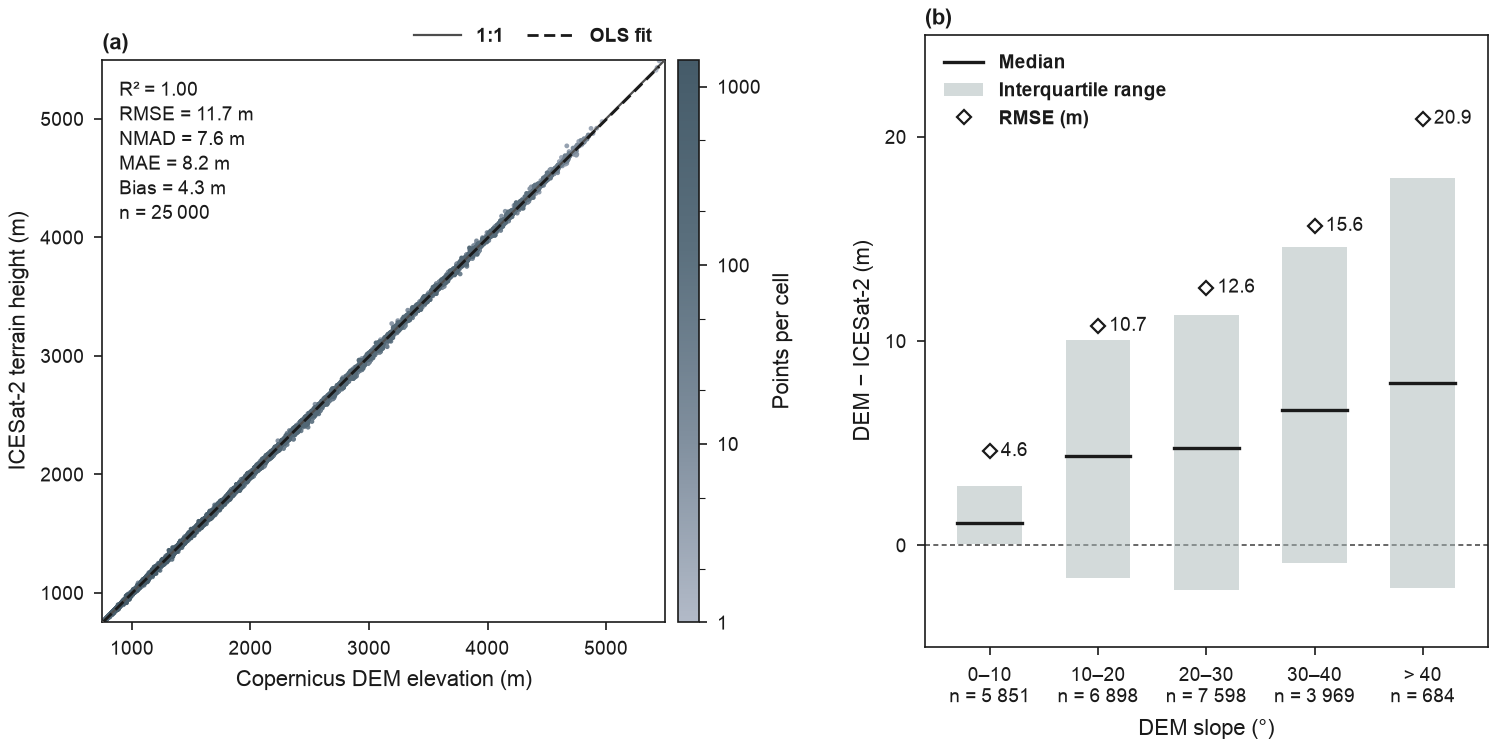
(a) Copernicus DEM GLO-90 elevation against ICESat-2 ATL08 terrain height at 25 000 randomly sampled land segments (2019–2024; strong beams, snow-free, cloud-free, at least 10 terrain photons), converted from the WGS 84 ellipsoid to EGM2008 heights, in the Swat valley (pre-2026 district boundary): the former Swat district (before January 2026), now Swat and Bar Swat. (b) DEM − ICESat-2 by DEM slope class: median, interquartile range and RMSE, with the number of segments per class. Full code and downloads: gallery.
Orientation and fitted line
By default the predicted values go on the x axis and the observed values on the y
axis, and the fitted line is the ordinary least-squares regression of observed on
predicted. This follows Piñeiro et al. (2008): regressing observed on predicted gives a
slope and intercept that describe the model directly (a slope below 1 means the model
overestimates high values and underestimates low ones; the intercept shows a constant bias),
whereas the reverse regression mixes the model's error into the slope.
orientation="observed_x" swaps the axes (the fit then regresses predicted on observed),
fit="rma" draws the reduced major axis line, and fit=None leaves the line out.
Piñeiro, G., Perelman, S., Guerschman, J. P., & Paruelo, J. M. (2008). How to evaluate models: Observed vs. predicted or predicted vs. observed? Ecological Modelling, 216(3–4), 316–322. https://doi.org/10.1016/j.ecolmodel.2008.05.006
Pairing the values
The statistics are only as good as the pairing of observed and predicted values.
accuracy_scatter pairs them as follows:
| Inputs | Paired by |
|---|---|
| two pandas Series (or DataFrames) | index labels: predicted is put in the order of observed |
| two xarray DataArrays | coordinates: dimensions and labels put in the order of observed |
| arrays, or one labelled input and one array | position |
Labelled inputs whose labels do not match one to one (labels missing on one side, or
repeated) raise an error that counts them, rather than pairing the wrong values; pass
.to_numpy() (or .values) to pair by position on purpose. A pandas Series or DataArray of
groups is aligned in the same way. fig.eofigs_layout["pairing"] records which rule was
used ("index", "coordinates" or "position").
eofigs 0.1.0 paired pandas inputs by position. If you passed two Series whose indexes were in different orders (for example after a merge, a sort or a train/test split), the statistics from 0.1.0 are wrong; re-run with 0.1.1 or later.
Statistics
With observed values O, predicted values P, their means Ō and P̄, and n pairs (pairs with a missing value in either are left out and counted in the record):
| Key | Shown as | Formula |
|---|---|---|
r2 |
R² | squared Pearson correlation of O and P |
r |
r | Pearson correlation |
nse |
NSE | Nash–Sutcliffe efficiency, 1 − Σ(P − O)² / Σ(O − Ō)² (it can be negative) |
rmse |
RMSE | √(Σ(P − O)² / n) |
rrmse |
rRMSE | 100 · RMSE / Ō (%) |
nmad |
NMAD | 1.4826 · median(|e − median(e)|) with e = P − O (Höhle and Höhle 2009) |
mae |
MAE | Σ|P − O| / n |
bias |
Bias | Σ(P − O) / n (positive: overestimation) |
rbias |
rBias | 100 · bias / Ō (%) |
slope, intercept |
Slope, Intercept | of the fitted line, in plot axes (y on x) |
n |
n | number of pairs |
R² is the squared correlation, as most remote sensing validation papers report it; the
agreement with the 1:1 line is carried by the RMSE and the bias. The coefficient of
determination against the 1:1 line is available as nse, so that a figure never shows a
value called R² that can be negative.
The NMAD (normalised median absolute deviation) is the robust spread of the errors that DEM validation usually reports next to the RMSE: for normally distributed errors it equals their standard deviation, and a few blunders barely change it, while they inflate the RMSE.
Höhle, J., & Höhle, M. (2009). Accuracy assessment of digital elevation models by means of robust statistical methods. ISPRS Journal of Photogrammetry and Remote Sensing, 64(4), 398–406. https://doi.org/10.1016/j.isprsjprs.2009.02.003
Numbers in the box carry three significant digits, the statistics with units share one
number of decimals, R², r, NSE and the slope get two decimals and the percentages one.
Every statistic is kept at full precision in fig.eofigs_layout["stats"] (and per group in
["groups"]), for tables.
Points, groups and density
- Up to 1 000 pairs: open circles. With
groups=(up to 6 categories), each group gets an Okabe-Ito colour and its own marker, and the caption lists R² and RMSE for each group. - Above 1 000 pairs (
density="auto"), each point is coloured by the number of points in its cell of a 60 × 60 grid over the axis range, on a log scale, with the densest points drawn on top. The points are rasterised inside vector PDFs, while the axes and text stay vector. - Both axes share the same limits and ticks, and the plot is square. The statistics box
goes in the corner with the fewest points (or
stats_loc=).
Several panels
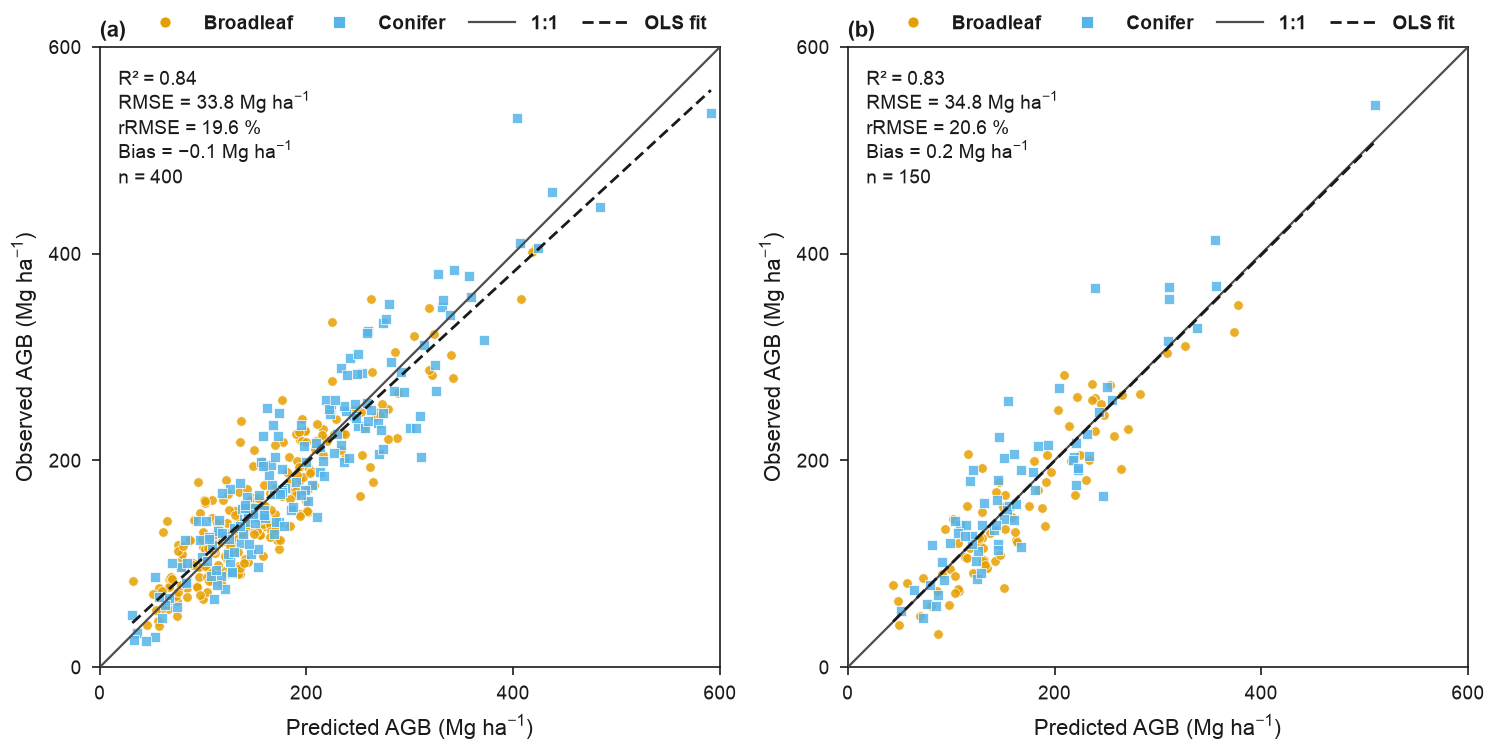
Pass ax= to draw one panel of a larger figure, for example calibration and validation:
fig, axes = eofigs.new_figure("double", ncols=2, height_mm=95)
eofigs.accuracy_scatter(obs_cal, pred_cal, variable="agb", ax=axes[0], labels=["(a)"])
eofigs.accuracy_scatter(obs_val, pred_val, variable="agb", ax=axes[1], labels=["(b)"])
The Swat ICESat-2 pairs
docs/scripts/build_swat_icesat2.py builds swat_icesat2_atl08_dem.csv in
docs/data/swat/:
- ICESat-2 ATL08 version 7 land segments (100 m) from 2019 to 2024, cut to the Swat box on NASA's servers with Harmony (a free NASA Earthdata login is needed to run the script);
- a quality rule that does not depend on slope: strong beams, valid best-fit terrain
heights, snow-free land (
segment_snowcover= 1), no cloud or blowing-snow layer (multiple-scattering warningmsw_flag= 0), at least 10 terrain photons per segment, and segment centres inside the Swat outline; - gross blunders (DEM and ICESat-2 more than 150 m apart) are dropped and counted: there are none, so all 27 619 segments that pass the rule are kept;
- a random subsample of 25 000 of them (seed 2019) is stored, to keep the file under 2 MB; every statistic in the gallery figure is computed from this sample;
- vertical datum: ATL08 heights are above the WGS 84 ellipsoid and the Copernicus DEM is referenced to the EGM2008 geoid; the ATL08 heights are converted to EGM2008 heights with PROJ and NGA's EGM2008 grid before the comparison (the geoid undulation over Swat is about −27 to −39 m, so skipping this step would add a bias of that size);
- the DEM elevation and slope are interpolated bilinearly at each segment centre.
The rule deliberately leaves out the ATL08 terrain height uncertainty (h_te_uncertainty):
it grows with the slope within a segment, so a limit on it acts as a slope filter. A 5 m
limit, for example, keeps 2 124 segments with a median DEM slope of 1° (against 26° over the
whole valley) and an RMSE of 4.2 m, an optimistic picture of the DEM's accuracy in
mountains. The stored sample keeps the steep terrain (median slope 20°).
The minimum number of terrain photons has a similar, weaker effect, because steep and
forested segments return fewer ground photons. With the other rules applied (strong beams,
snow-free, msw_flag = 0, inside the outline, DEM values available):
| Minimum terrain photons | Segments | Median DEM slope |
|---|---|---|
| none | 30 797 | 20.4° |
| 10 (used) | 27 619 | 19.6° |
| 30 | 17 013 | 15.8° |
| 50 | 10 476 | 11.0° |
A minimum of 10 drops the sparsest terrain fits while keeping the slope mix of the valley; stricter minimums again favour gentle slopes.
Over a 4 km elevation range, metre-level differences are invisible in a scatter: the points lie on the 1:1 line and R² rounds to 1.00, so panel (b) shows the errors themselves. In the sample the DEM is on average 4.3 m above ICESat-2 (RMSE 11.7 m, NMAD 7.6 m). The median difference grows from 1.1 m below 10° to 7.9 m above 40°, and the RMSE from 4.6 m to 20.9 m.