Style and export
Every eofigs figure starts from the printed size. Choose a journal, create the figure at a column width in millimetres, and save it in the journal's formats with a check report.
import eofigs

eofigs.set_style("elsevier")
fig, (ax1, ax2) = eofigs.new_figure("double", height_mm=65, ncols=2)
ax1.plot(years, ndvi_forest, marker="o", label="Forest")
...
eofigs.tidy_axes(ax1, colour_bar)  # at most five ticks, at round values
eofigs.label_panels([ax1, ax2])
report = eofigs.save_figure(fig, "figures/fig2")  # fig2.pdf + fig2.tiff for Elsevier
print(report)
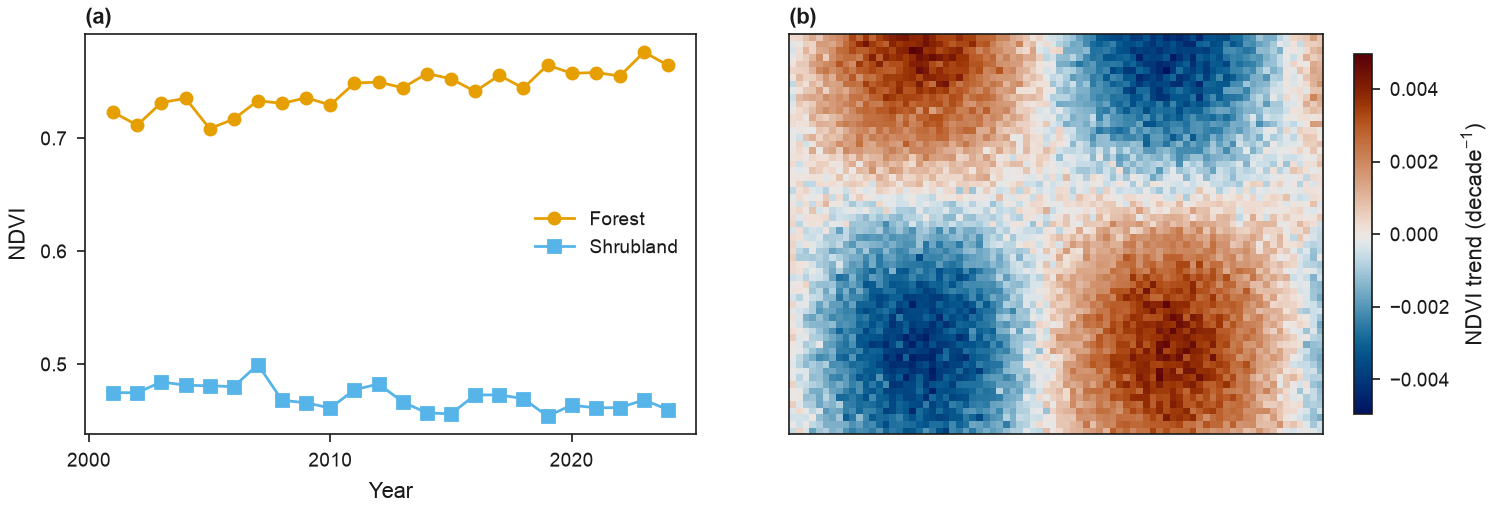
The full script, the downloads and the check report are on the gallery page.
save_figure adds the same checks for each written PDF, PNG or TIFF file, including the
fonts embedded in the PDF.
Styles
set_style applies a journal style for the rest of a script; style does the same inside a
with block and restores matplotlib's settings afterwards, which keeps notebooks clean.
| Setting | Default |
|---|---|
| Font | the journal's preferred family; font="serif", "sans-serif" or a font name |
| Fallback fonts | Times New Roman → Liberation Serif → TeX Gyre Termes; Arial → Liberation Sans → Arimo (a warning names the substitute) |
| Sizes | journal base size (8 pt), tick labels 1 pt smaller but never below the journal minimum |
| Units and symbols | matplotlib mathtext, matched to the text font (STIX for serif, DejaVu Sans for sans-serif) |
| Bold | bold=True for Times New Roman Bold–style figures |
| Colours | Okabe–Ito for lines and markers; cmcrameri batlow for images |
| Panel labels | labels="(a)", bold; "a", "(A)", "A", "a)" or None |
| Minus sign | true minus (−), not a hyphen |
| PDF fonts | TrueType (Type 42), never Type 3 |
Write units with mathtext, for example r"gC m$^{-2}$ yr$^{-1}$", not with Unicode
superscripts: some journal fonts have no glyph for "⁻¹" and print an empty box.
An author or lab style in one call
Package defaults stay generic. An author or a lab sets its own look with one call at the top of a script, for example bold Arial text with bold capital panel letters and at most five ticks per axis:
eofigs.set_style(journal="custom", font="Arial", bold=True, labels="A", max_ticks=5)
This sets every text element in bold, falls back to Liberation Sans or Arimo where Arial is
not installed (with a warning), makes label_panels write bold A, B, ... just
outside the top-left corner of each panel, and turns on the tick rule (below). A journal preset can be combined with it
(journal="elsevier") to keep that journal's sizes and resolution.
Some authors keep panel titles out of figures: the phases or periods go in the caption and
each panel carries only its letter. set_style(..., panel_titles=False) makes every recipe
follow that rule; recipes that would title their panels (for example the "Before (3 months)",
"During" and "After (6 months)" maps of event_composite) then name the panels in their
caption sentence instead: "(a) before, 3 months; (b) during; (c) after, 6 months; (d)
composite series".
Ticks and dense layers
tidy_axes(ax, colour_bar, ...)gives each axis and colour bar four or five ticks at round values (1, 2, 2.5 and 5 times a power of ten) inside the axis range, for example 1000 to 4000 m on an elevation axis from 500 to 4500 m; at most five, or themax_ticksset withset_style. Ticks set explicitly, log axes and map axes are left alone; date axes get concise date labels. Every eofigs recipe calls it.set_style(max_ticks=5)makes a tick limit a house rule:check_figurethen warns about axes with more tick labels. Without it (the default) ticks are not checked, because the number of ticks is a matter of style, not a journal requirement.save_figurerasterises dense layers in vector files: mesh plots (pcolormesh) and collections with more than 2 000 elements (dense scatter plots, many polygons) are drawn as an image at the output resolution inside the PDF, while text, axes and lines stay vector. Passrasterize_dense=Falseto keep everything vector.- Figures without panels get no panel letter: call
label_panelsonly for multi-panel figures.
Sizes
new_figure takes a named width ("single", "onehalf", "double") or a number in mm,
and a height in mm or an aspect ratio. Heights above the journal maximum raise an error.
save_figure never trims the figure, so the file has exactly the printed size; use
size_px= when a fixed pixel width is required.
Artwork type
Publishers ask for more resolution for line art (plots and drawings without images) than
for figures that combine text and images. Pass art= to save_figure and check_figure:
art |
Meaning | Elsevier | Springer, Taylor & Francis |
|---|---|---|---|
"combination" (default) |
text with images or maps | 500 dpi | 600 dpi |
"line" |
line art: plots, charts, diagrams | 1000 dpi | 1200 dpi |
"halftone" |
photographs and continuous-tone images | 300 dpi | 300 dpi |
Raster files are written at the preset's export resolution (600 dpi) or the requirement,
whichever is higher, so save_figure(fig, "fig3", art="line") writes a 1000 dpi TIFF for
Elsevier. Vector PDFs are not affected.
Figure check
check_figure works on a live figure or on an exported file.
| Check | Rule |
|---|---|
| Size | width matches a column width (warning otherwise); not wider or taller than the journal allows |
| Resolution | at least the journal's resolution for the artwork type (art=) |
| Font size | smallest text at least the journal minimum |
| Fonts | fonts in use (live figure) or embedded (PDF); Type 3 fonts fail. Metric-compatible free fonts pass in place of the journal's fonts, with a note: Liberation Sans and Arimo for Arial, TeX Gyre Heros for Helvetica, Liberation Serif, Tinos and TeX Gyre Termes for Times New Roman |
| Colour-blind safety | line, marker, bar and fill colours differ by CIEDE2000 ≥ 10 in normal vision and ≥ 6 under simulated protan, deutan and tritan vision (Machado et al. 2009); close pairs are a warning, because markers, line styles or direct labels can separate them |
| Colour maps | sequential maps need monotonic lightness, diverging maps monotonic lightness on each side of the centre, cyclic and categorical maps are exempt; rainbow-type maps (jet, rainbow, hsv, turbo, ...) fail |
| Ticks | only with set_style(max_ticks=...): at most that many tick labels per axis (warning otherwise; tidy_axes fixes it) |
cvd_preview shows the figure as seen with colour-vision deficiencies; see
Colours.