Journal style and export
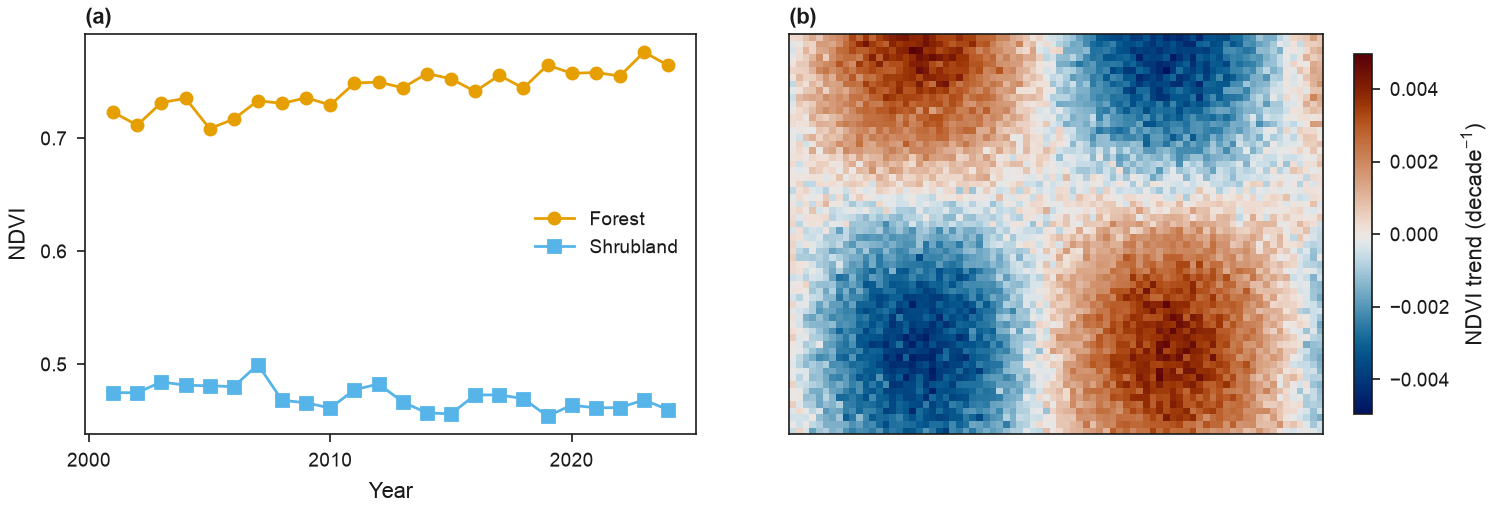
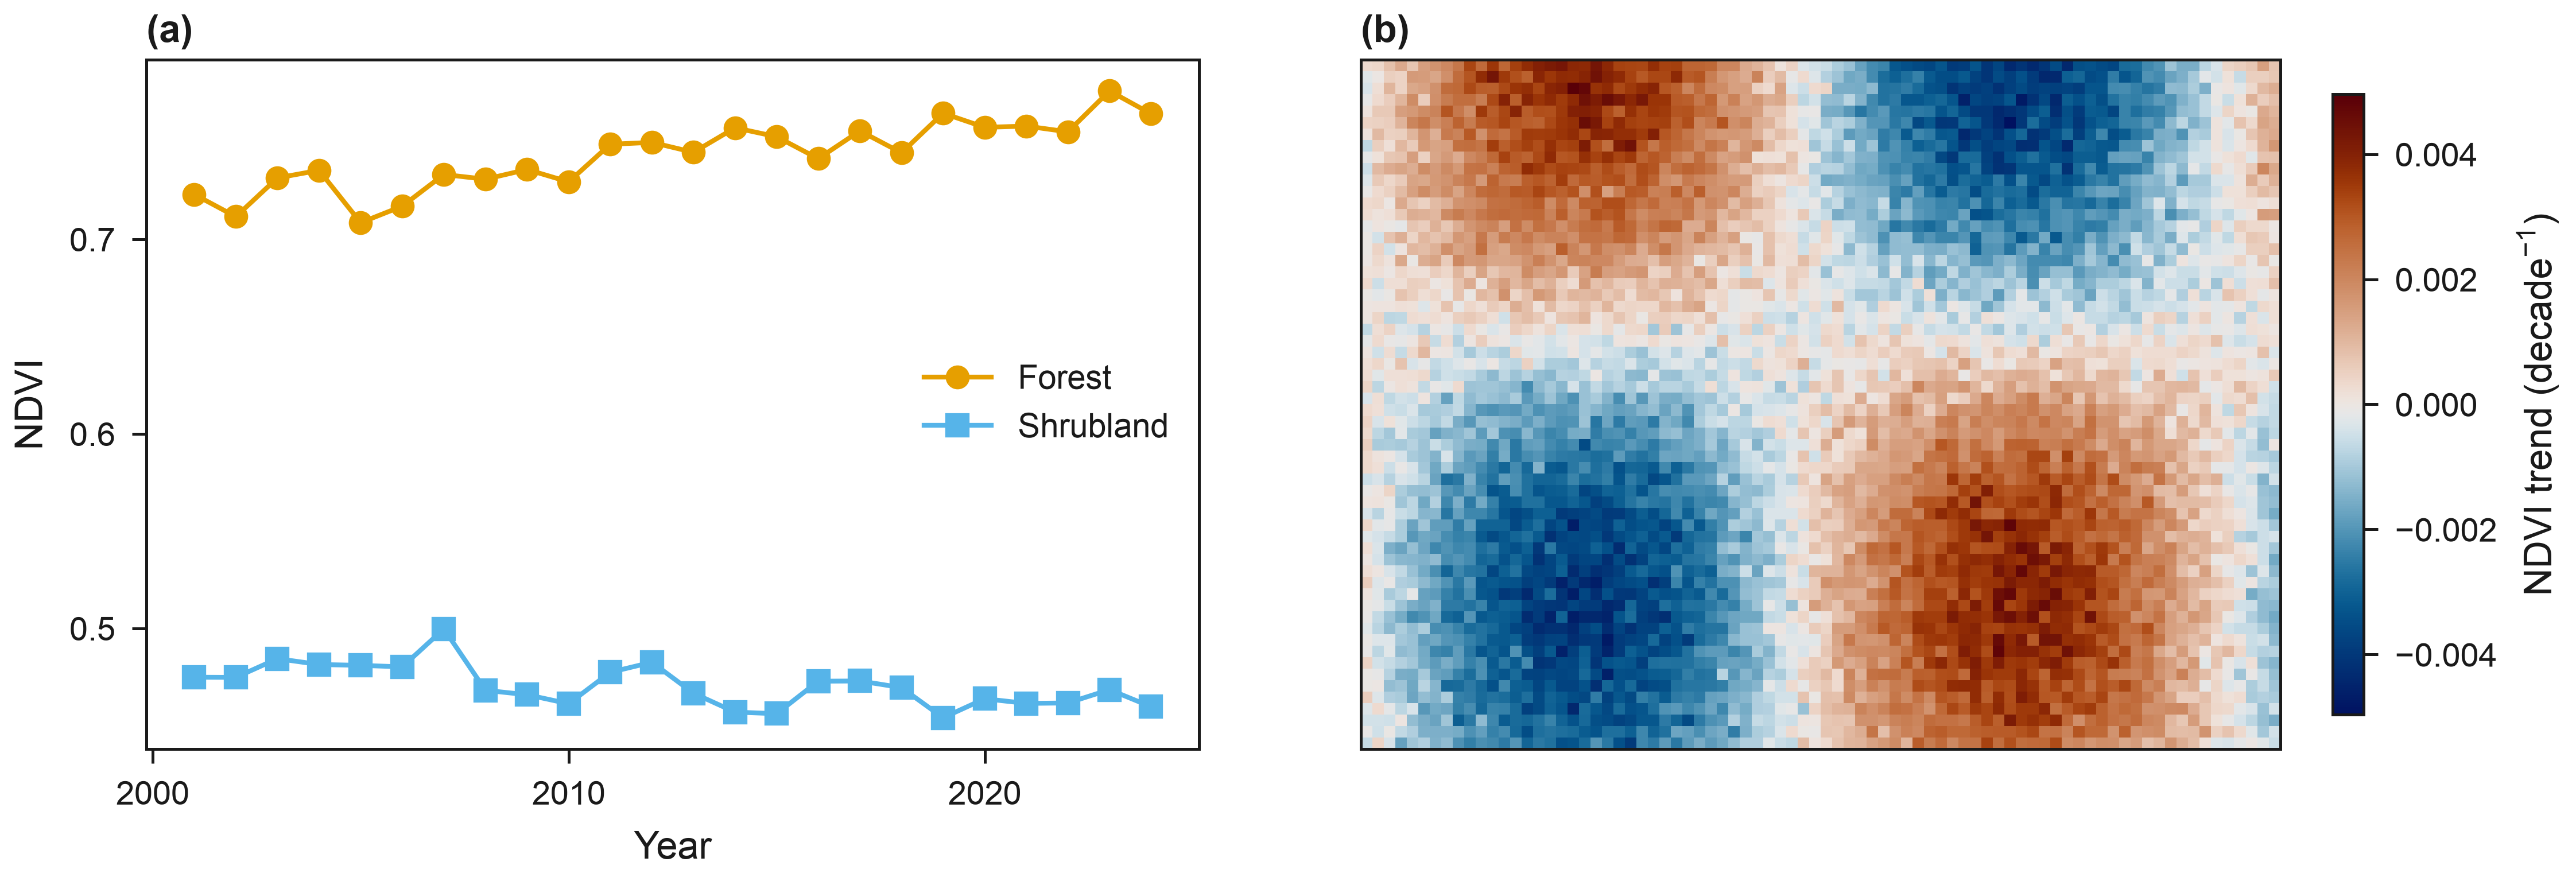
A double-column figure in the Elsevier preset: (a) synthetic annual NDVI of a forest and a shrubland plot, (b) a synthetic NDVI trend map with zero-centred vik colours. The figure is 190 mm wide, set at 8 pt with panel labels, and saved as a vector PDF plus a 600 dpi TIFF. Synthetic data.
import cmcrameri.cm as cmc
import numpy as np

import eofigs

rng = np.random.default_rng(42)
years = np.arange(2001, 2025)
ndvi_forest = 0.72 + 0.002 * (years - 2001) + rng.normal(0, 0.01, years.size)
ndvi_shrub = 0.48 - 0.001 * (years - 2001) + rng.normal(0, 0.012, years.size)
y, x = np.mgrid[0:60, 0:80]
trend = 0.004 * np.sin(x / 12) * np.cos(y / 15) + rng.normal(0, 0.0004, (60, 80))

eofigs.set_style("elsevier")
fig, (ax1, ax2) = eofigs.new_figure("double", height_mm=65, ncols=2)

ax1.plot(years, ndvi_forest, marker="o", label="Forest")
ax1.plot(years, ndvi_shrub, marker="s", label="Shrubland")
ax1.set_xlabel("Year")
ax1.set_ylabel("NDVI")
ax1.legend(loc="center right")

limit = np.abs(trend).max()
image = ax2.imshow(trend, cmap=cmc.vik, vmin=-limit, vmax=limit)
ax2.set_xticks([])
ax2.set_yticks([])
bar = fig.colorbar(image, ax=ax2, label=r"NDVI trend (decade$^{-1}$)", shrink=0.9)

eofigs.tidy_axes(ax1, bar)
eofigs.label_panels([ax1, ax2])

if __name__ == "__main__":
    report = eofigs.save_figure(fig, "style_export")  # style_export.pdf + .tiff for Elsevier
    print(report)
Figure check
Figure check (elsevier): passed
  PASS  size: 190.0 x 65.0 mm (double width).
  PASS  resolution: 600 dpi (at least 500 for figures with text and images).
  PASS  font size: Smallest text 7 pt (minimum 7 pt).
  PASS  fonts: Fonts in use: Arial.
  PASS  colour-blind safety: 2 categorical colours, all distinguishable.
  PASS  colour maps: Colour maps: vik (diverging).