Trend and significance
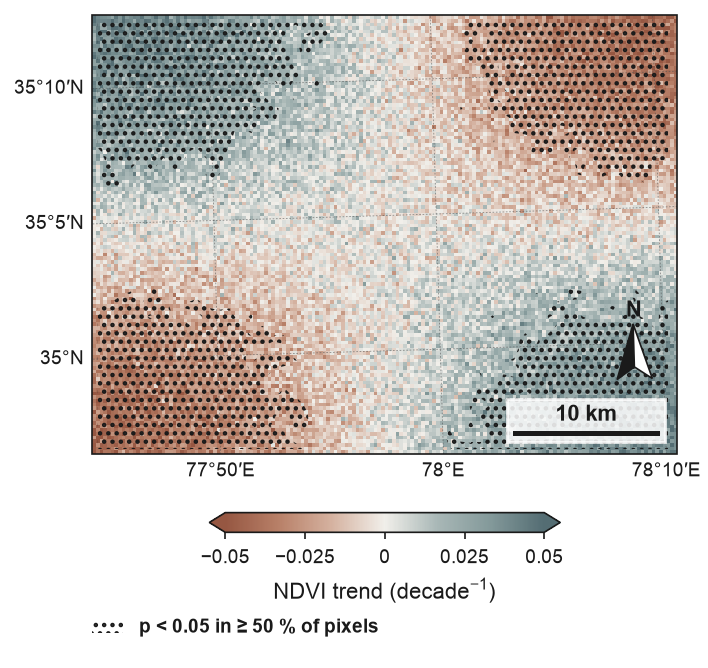
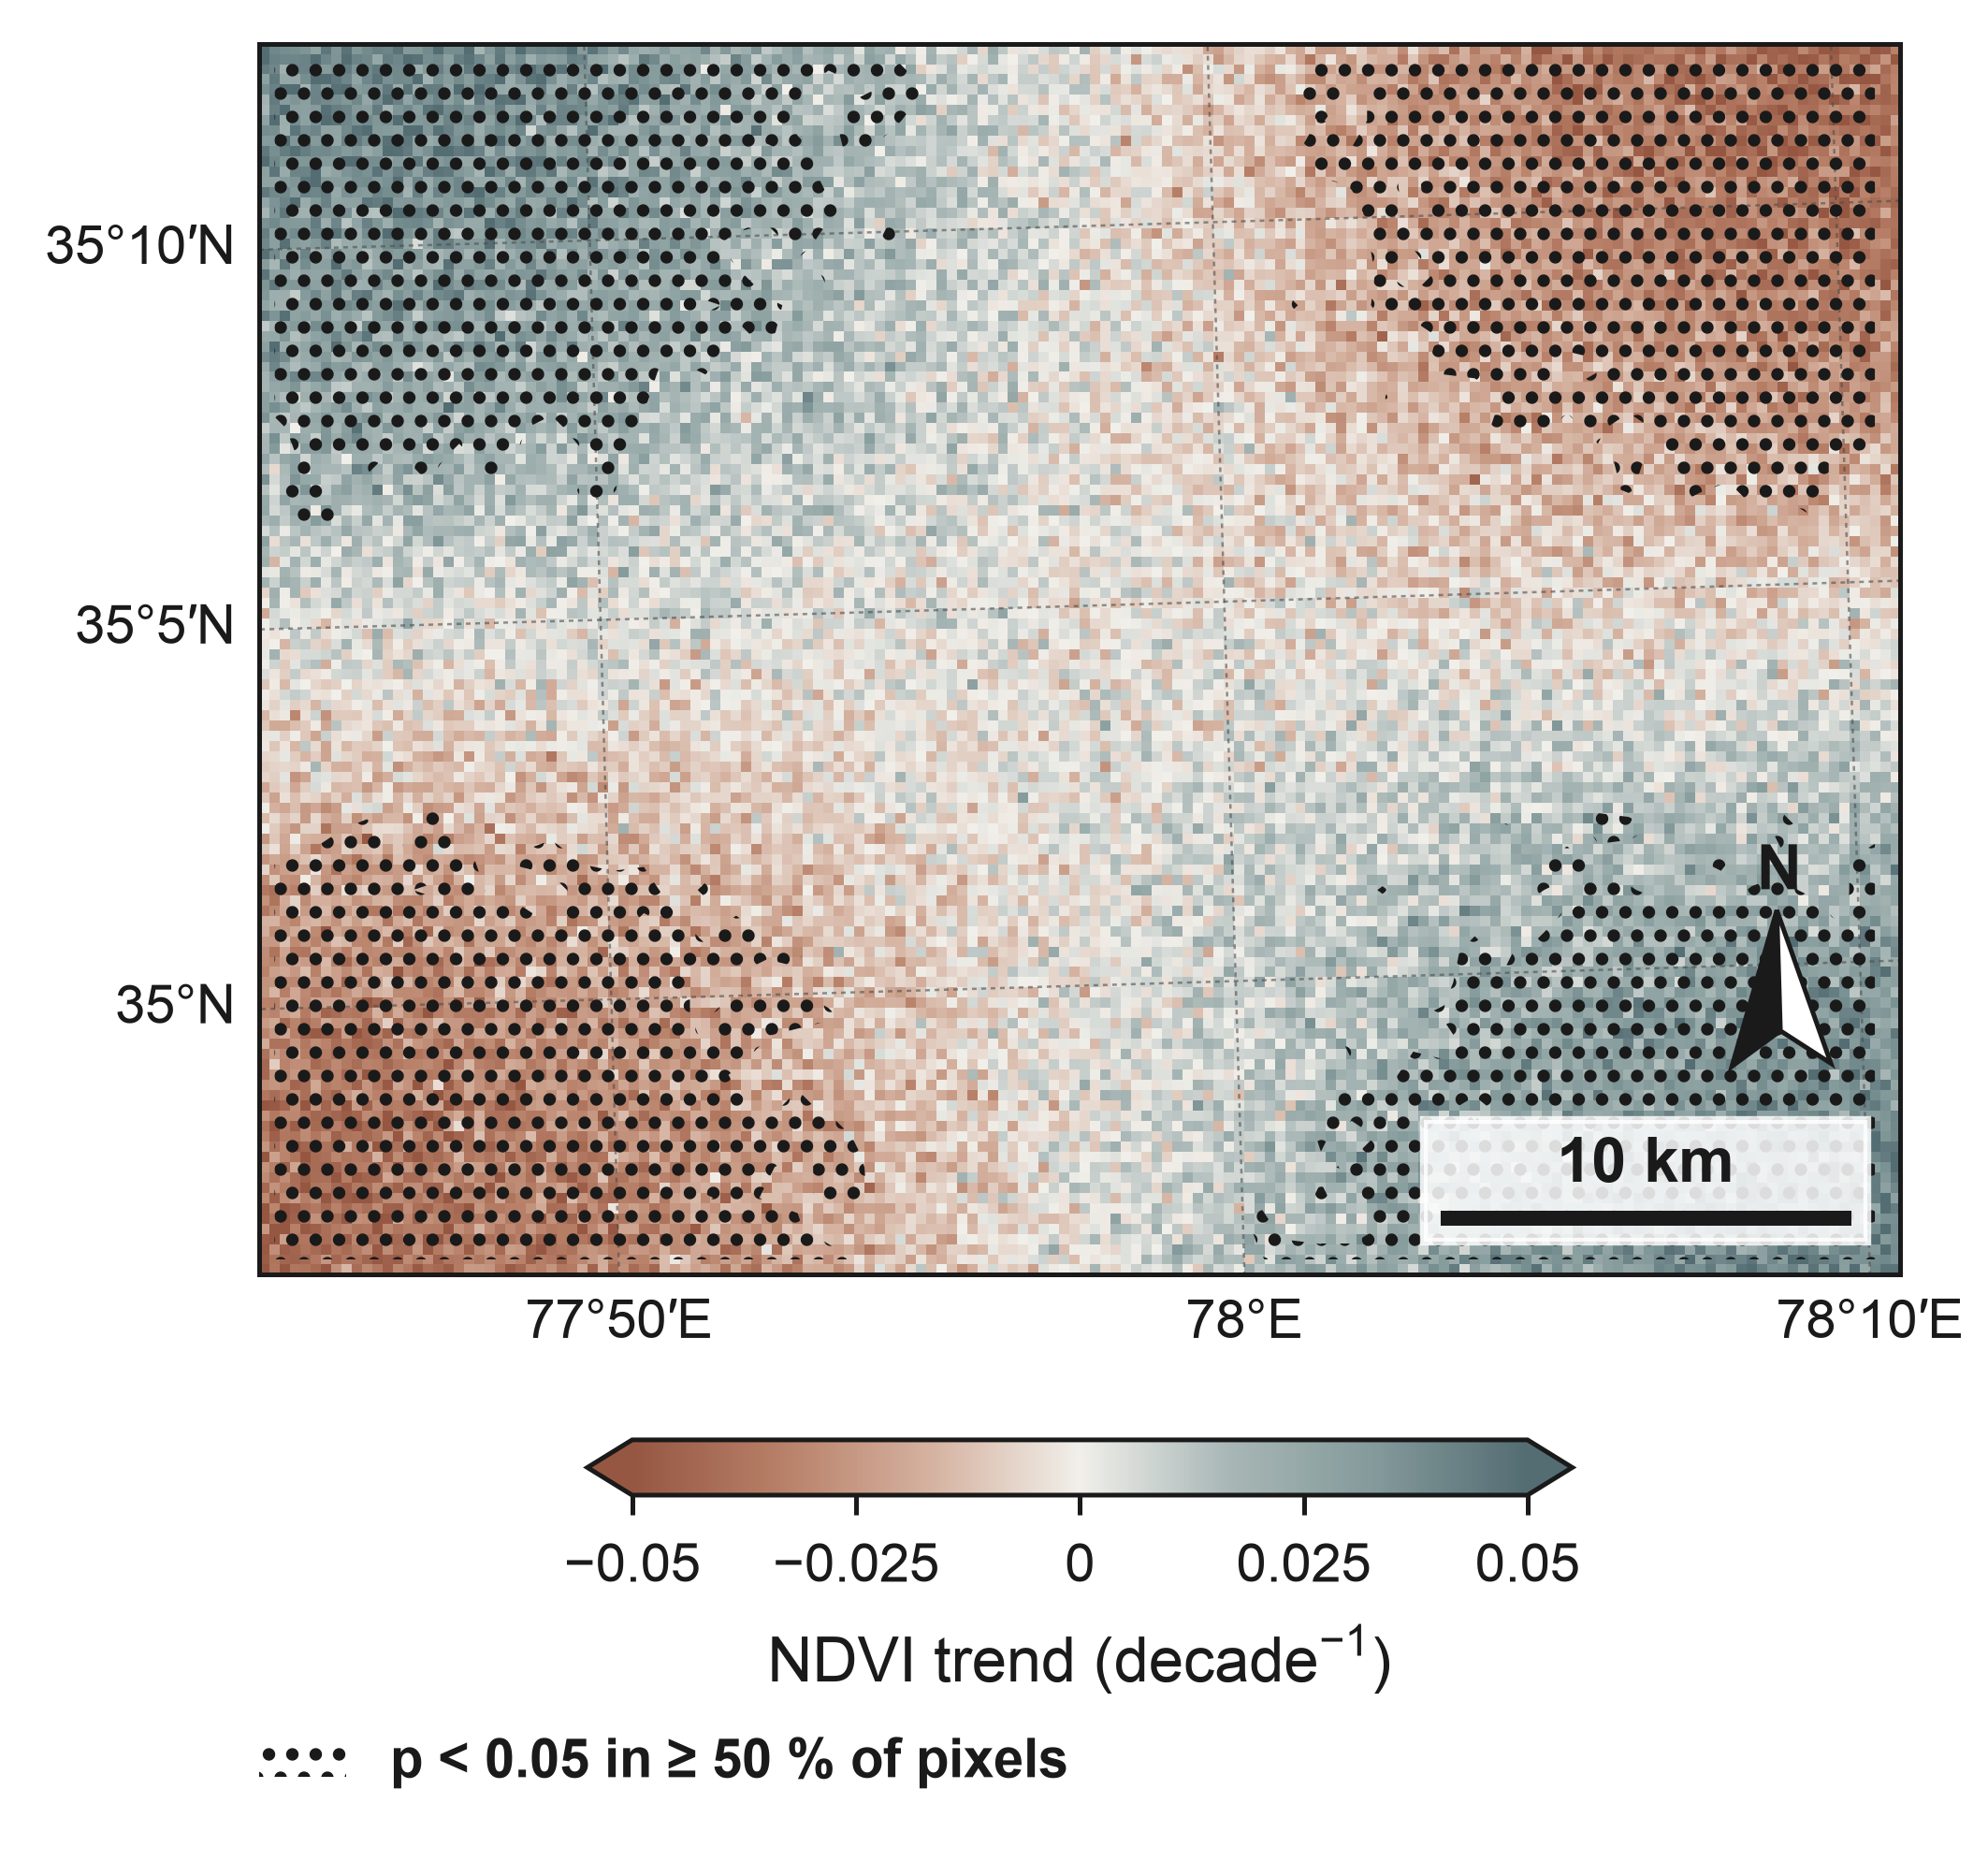
Theil–Sen slope and Mann–Kendall test of a synthetic annual NDVI series (2000–2024, 120 × 160 pixels of 250 m) with greening in the north-west, browning in the south-east and noise, drawn with trend_map(stipple="hatch"): zero-centred vegetation trend colours (terracotta browning, slate-teal greening), colours limited at the rounded 98th percentile of |slope| (the share of clipped pixels is in the caption sentence that trend_map writes), and hatching where at least 50 % of the pixels in each 1.6 mm cell are significant (p < 0.05). Synthetic data.
import numpy as np
import pandas as pd
import rioxarray  # noqa: F401  (adds the .rio accessor)
import xarray as xr

import eofigs

rng = np.random.default_rng(7)
years = pd.date_range("2000-01-01", periods=25, freq="YS")
y, x = np.mgrid[0:120, 0:160]
y, x = y / 120, x / 160
pattern = 0.004 * np.cos(np.pi * x) * np.cos(np.pi * y)  # NDVI per year
t = np.arange(25)[:, None, None]
ndvi = 0.55 + pattern[None] * t + rng.normal(0, 0.03, (25, 120, 160))
cube = xr.DataArray(
    ndvi,
    dims=("time", "y", "x"),
    coords={
        "time": years,
        "y": 3_900_000 - (np.arange(120) + 0.5) * 250,
        "x": 750_000 + (np.arange(160) + 0.5) * 250,
    },
    name="ndvi",
).rio.write_crs("EPSG:32643")

eofigs.set_style("elsevier")
fig = eofigs.trend_map(cube, stipple="hatch", width="single")

if __name__ == "__main__":
    print(fig.eofigs_layout["caption"])
    print(eofigs.save_figure(fig, "trend_significance"))
Figure check
Figure check (elsevier): passed
  PASS  size: 90.0 x 84.9 mm (single width).
  PASS  resolution: 600 dpi (at least 500 for figures with text and images).
  PASS  font size: Smallest text 7 pt (minimum 7 pt).
  PASS  fonts: Fonts in use: Arial.
  PASS  colour-blind safety: 2 categorical colours, all distinguishable.
  PASS  colour maps: Colour maps: eofigs.terra_slate (diverging).