Event composite: Swat hot-dry months
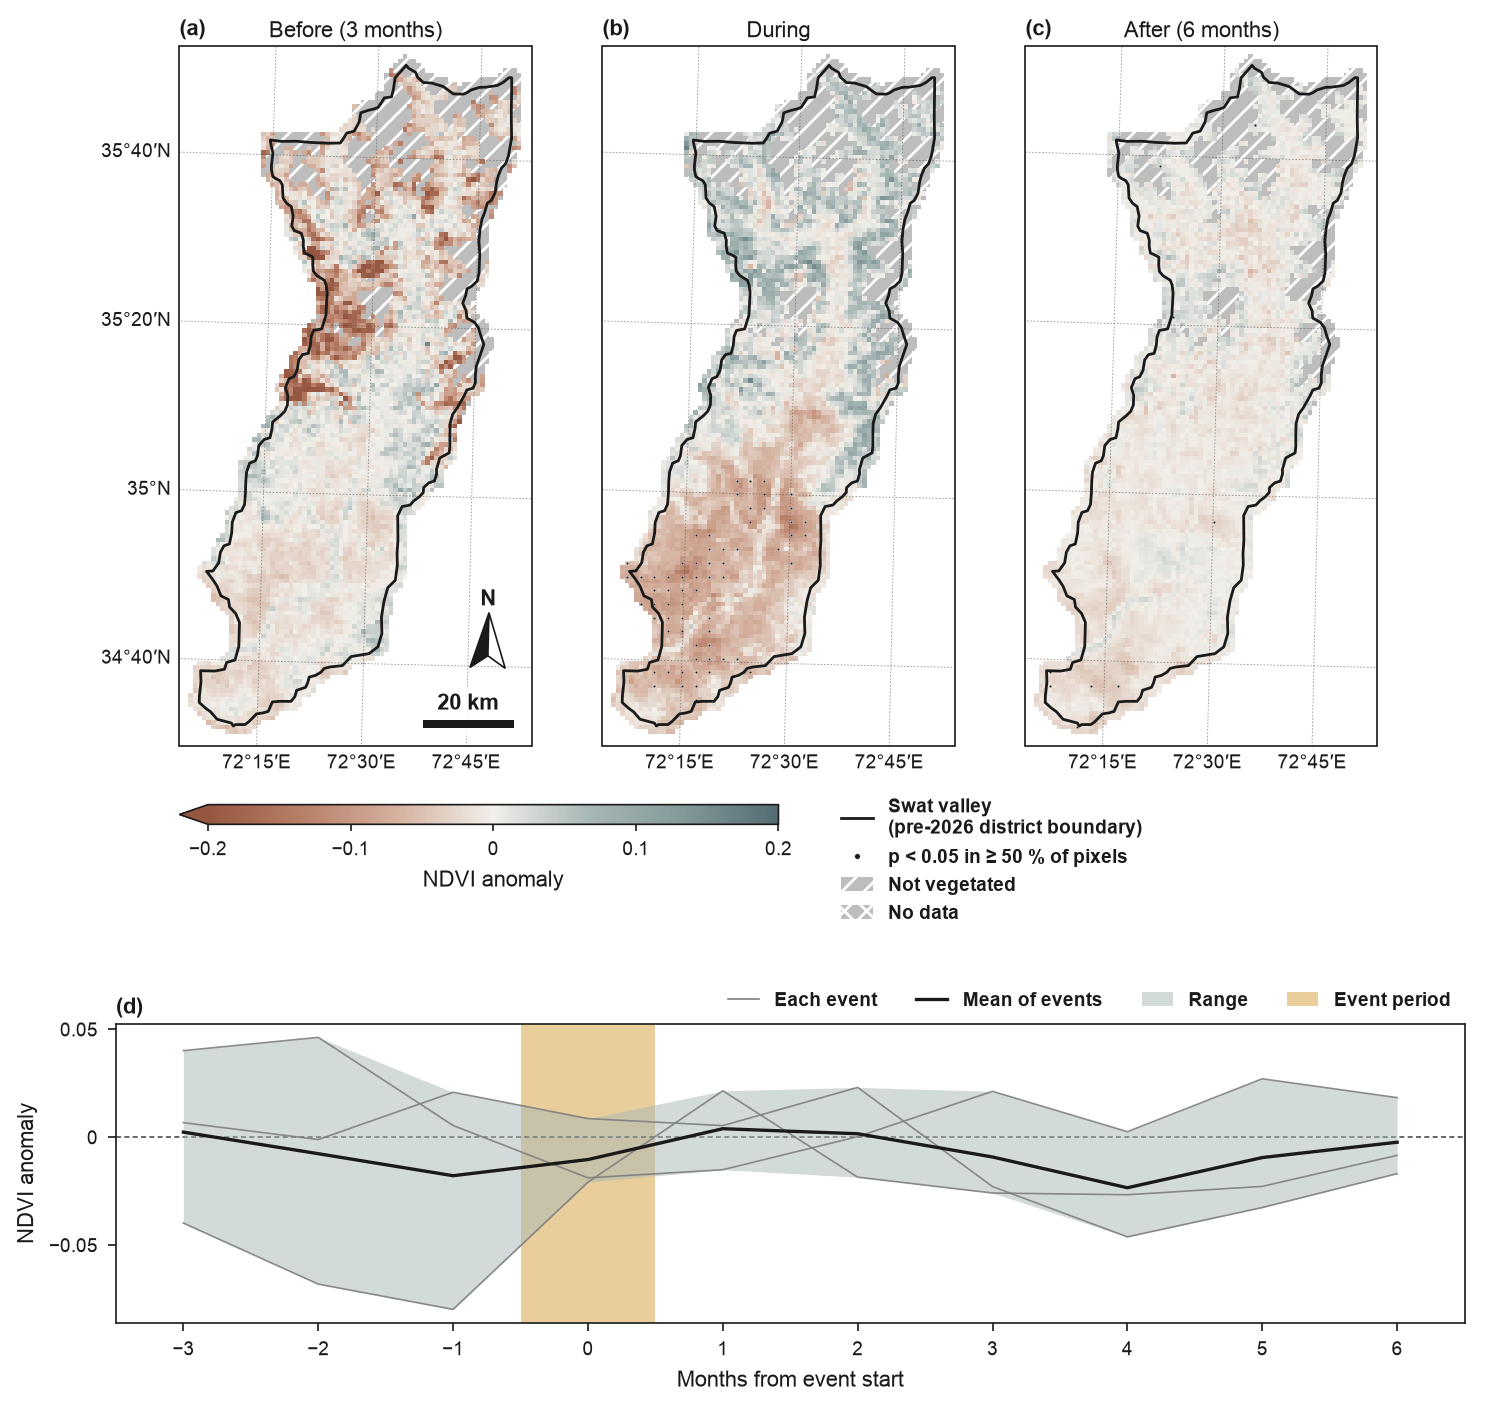
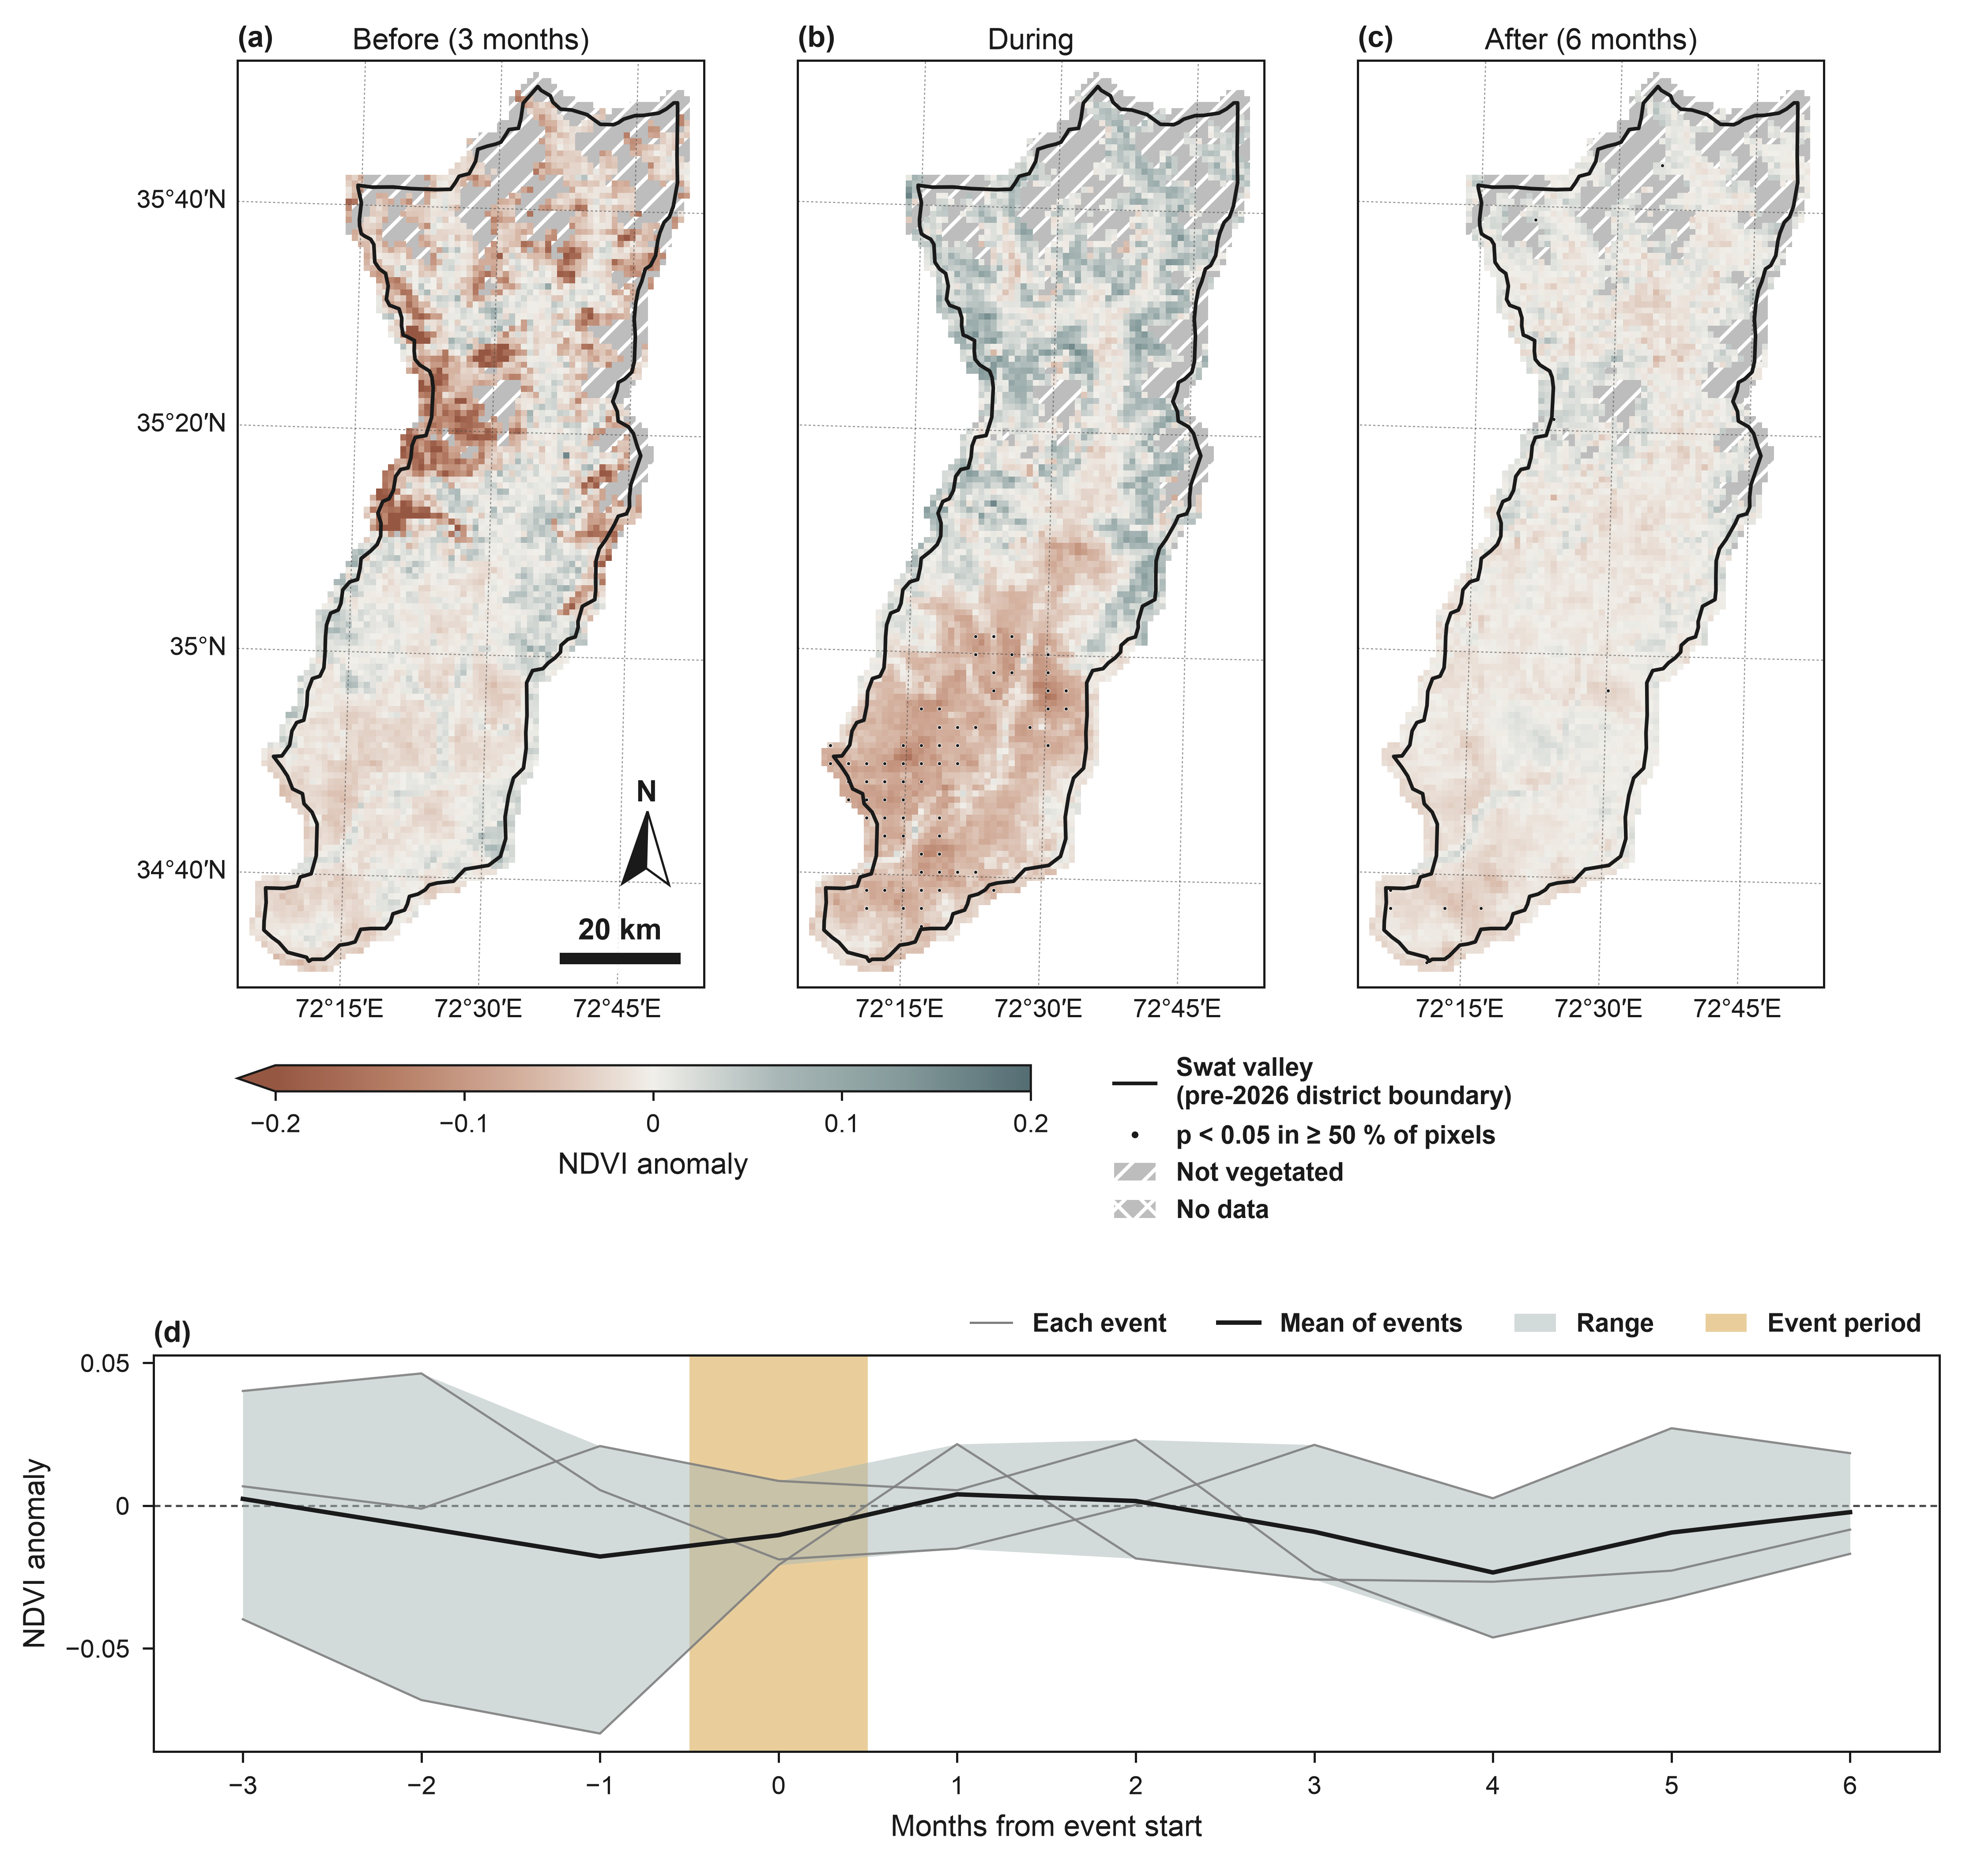
NDVI anomalies around compound hot-dry months in the Swat valley (pre-2026 district boundary): the former Swat district (before January 2026), now Swat and Bar Swat (geoBoundaries). Events: May–September months in which the Swat-mean maximum temperature z-score is at least +1 and the precipitation z-score at most −1 (TerraClimate, monthly climatology 2001–2021); consecutive months form one event. NDVI: monthly median of MODIS Terra MOD13A1 v6.1 16-day composites (pixel reliability 0–1), averaged to 1 km, 2001–2021. Anomalies from the monthly climatology of the months outside the event windows, after removing a per-pixel linear trend fitted to those months. The caption sentence with the events, the colour limits, the significance rule (per-pixel tests across events, not adjusted for multiple comparisons) and the masked classes comes from fig.eofigs_layout["caption"]; the event table is docs/data/swat/swat_hot_dry_events.csv. TerraClimate: Abatzoglou et al. (2018), CC0 1.0. MODIS data: NASA LP DAAC. Both accessed through the Microsoft Planetary Computer. Boundaries and names shown do not imply any opinion on the legal status of any country or territory.
from pathlib import Path

import pandas as pd
import rioxarray

import eofigs

DATA = Path(__file__).resolve().parents[1] / "docs" / "data" / "swat"


def swat_monthly_ndvi():
    """Load the monthly NDVI series (one band per month) with a time axis."""
    raw = rioxarray.open_rasterio(DATA / "swat_ndvi_monthly_1km.tif", mask_and_scale=True)
    months = pd.to_datetime([f"{month}-01" for month in raw.attrs["long_name"]])
    cube = raw.rename(band="time").assign_coords(time=months)
    cube.name = "ndvi"
    cube.attrs = {"long_name": "NDVI", "units": "1"}
    return cube


table = pd.read_csv(DATA / "swat_hot_dry_events.csv")
events = list(zip(table["start"] + "-01", table["end"] + "-01", strict=True))
threshold = table["threshold"].iloc[0]

eofigs.set_style("elsevier")
fig = eofigs.event_composite(
    swat_monthly_ndvi(),
    events,
    event_rule=(
        f"May–September months with Swat-mean maximum temperature z ≥ +{threshold:g} and "
        f"precipitation z ≤ −{threshold:g} (TerraClimate, 2001–2021); consecutive months "
        "form one event"
    ),
    aoi=DATA / "swat_boundary.geojson",
    aoi_label="Swat valley\n(pre-2026 district boundary)",
)


# README card: the three maps, the colour bar and the legend
readme_card = [*fig.axes[:4], *fig.legends]

if __name__ == "__main__":
    print(fig.eofigs_layout["caption"])
    print(eofigs.save_figure(fig, "event_composite_swat"))
Figure check
Figure check (elsevier): passed
  PASS  size: 190.0 x 180.0 mm (double width).
  PASS  resolution: 600 dpi (at least 500 for figures with text and images).
  PASS  font size: Smallest text 7 pt (minimum 7 pt).
  PASS  fonts: Fonts in use: Arial.
  PASS  colour-blind safety: 6 categorical colours, all distinguishable.
  PASS  colour maps: Colour maps: eofigs.terra_slate (diverging).