House style
-
Package default
-
House style in one call
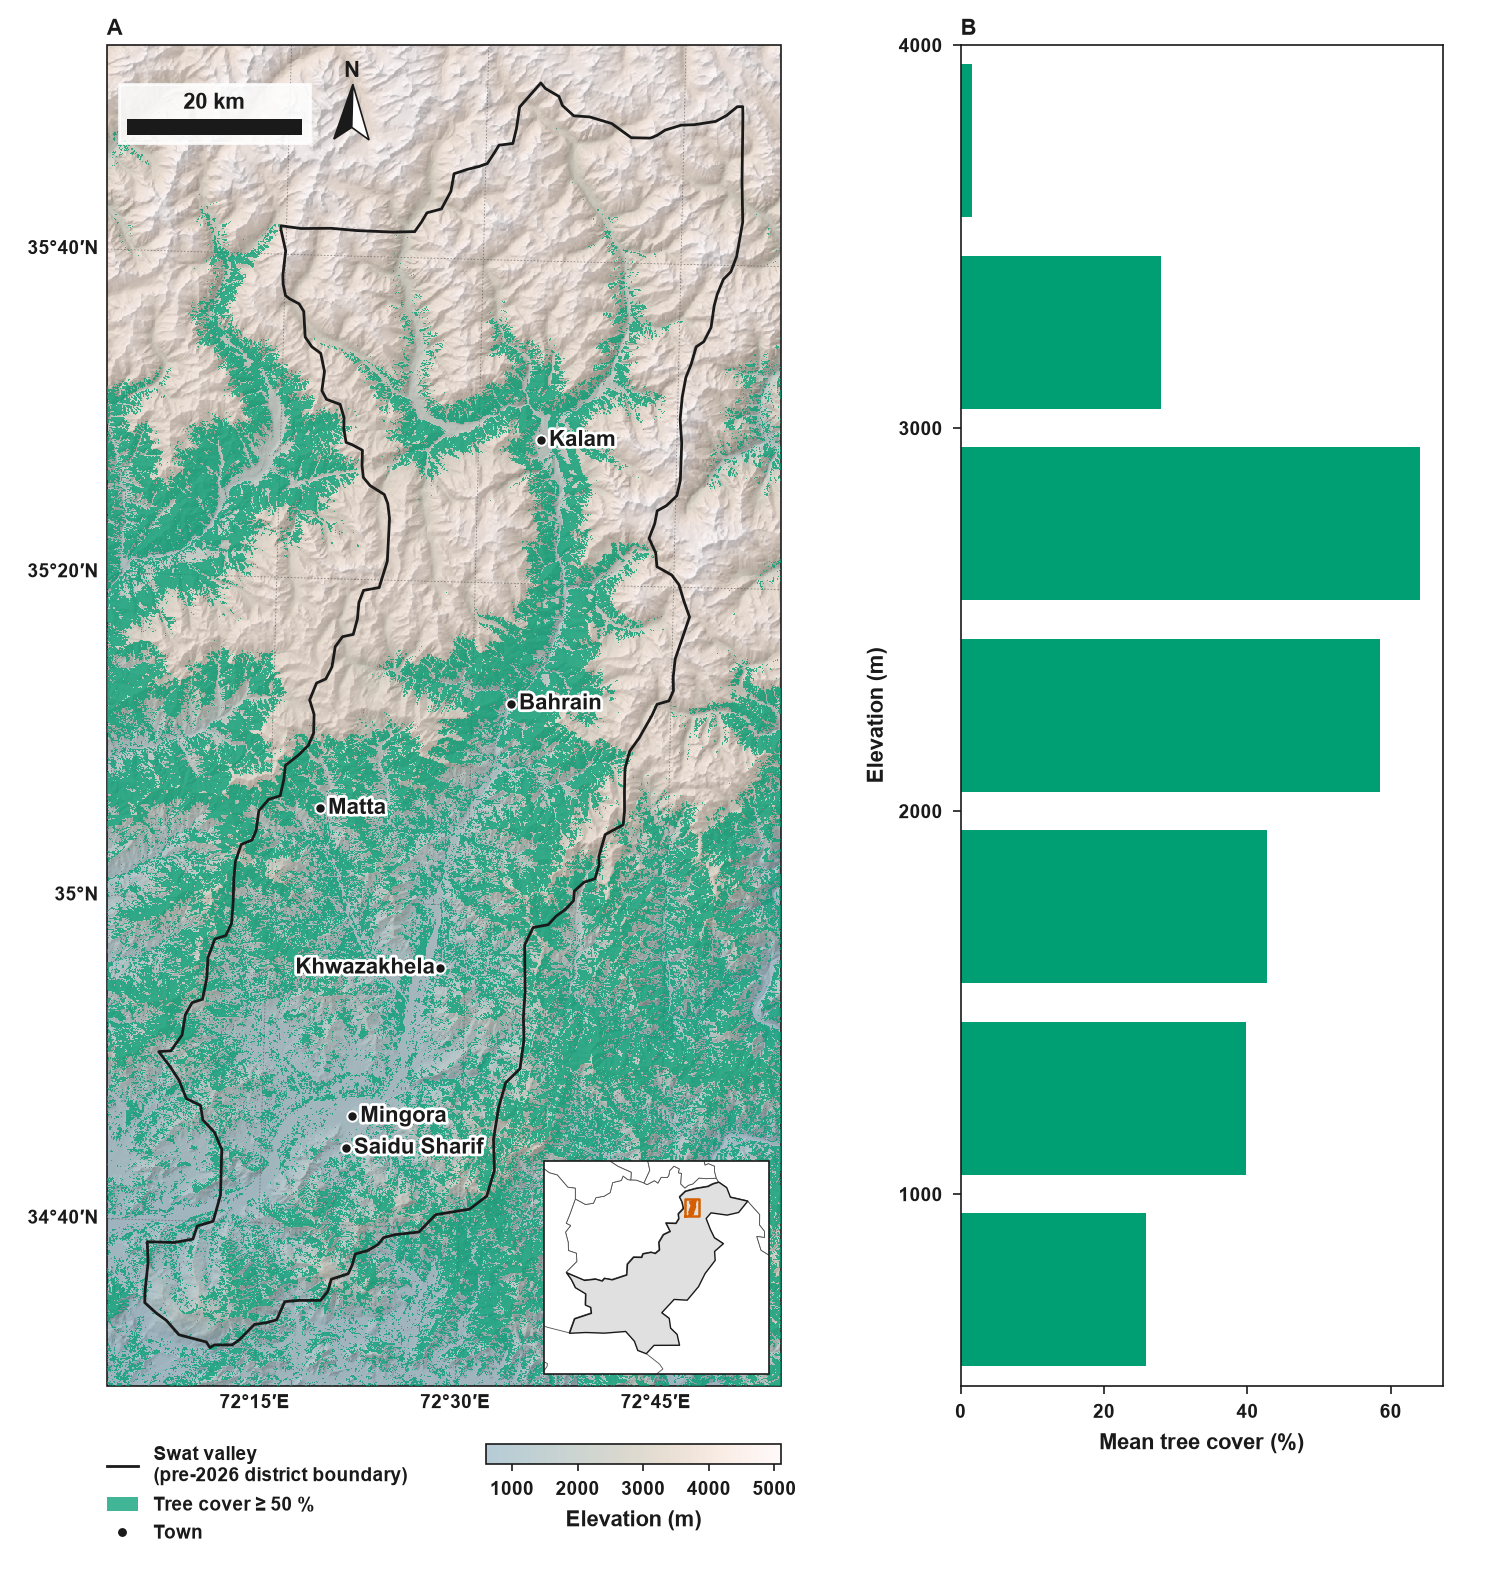
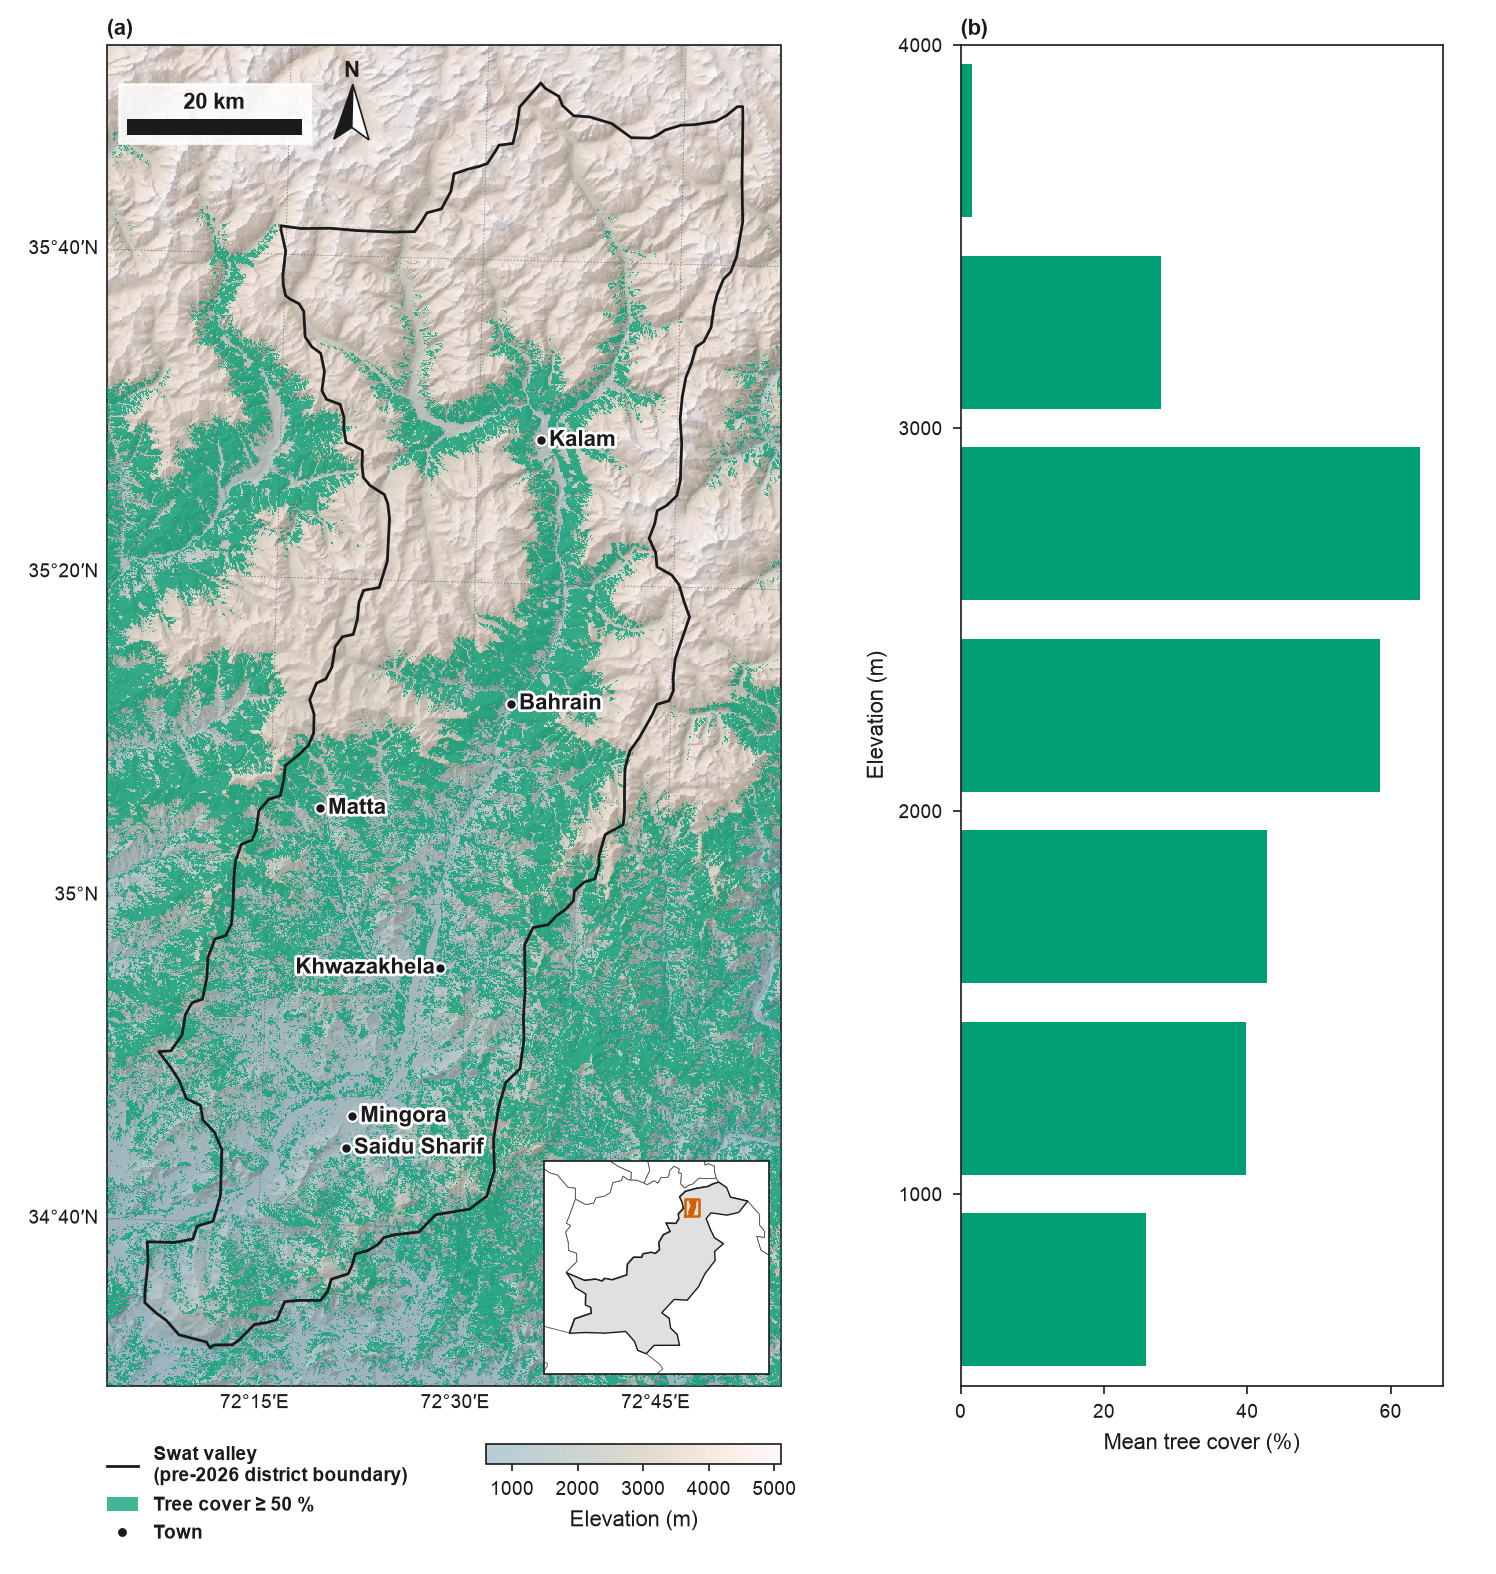
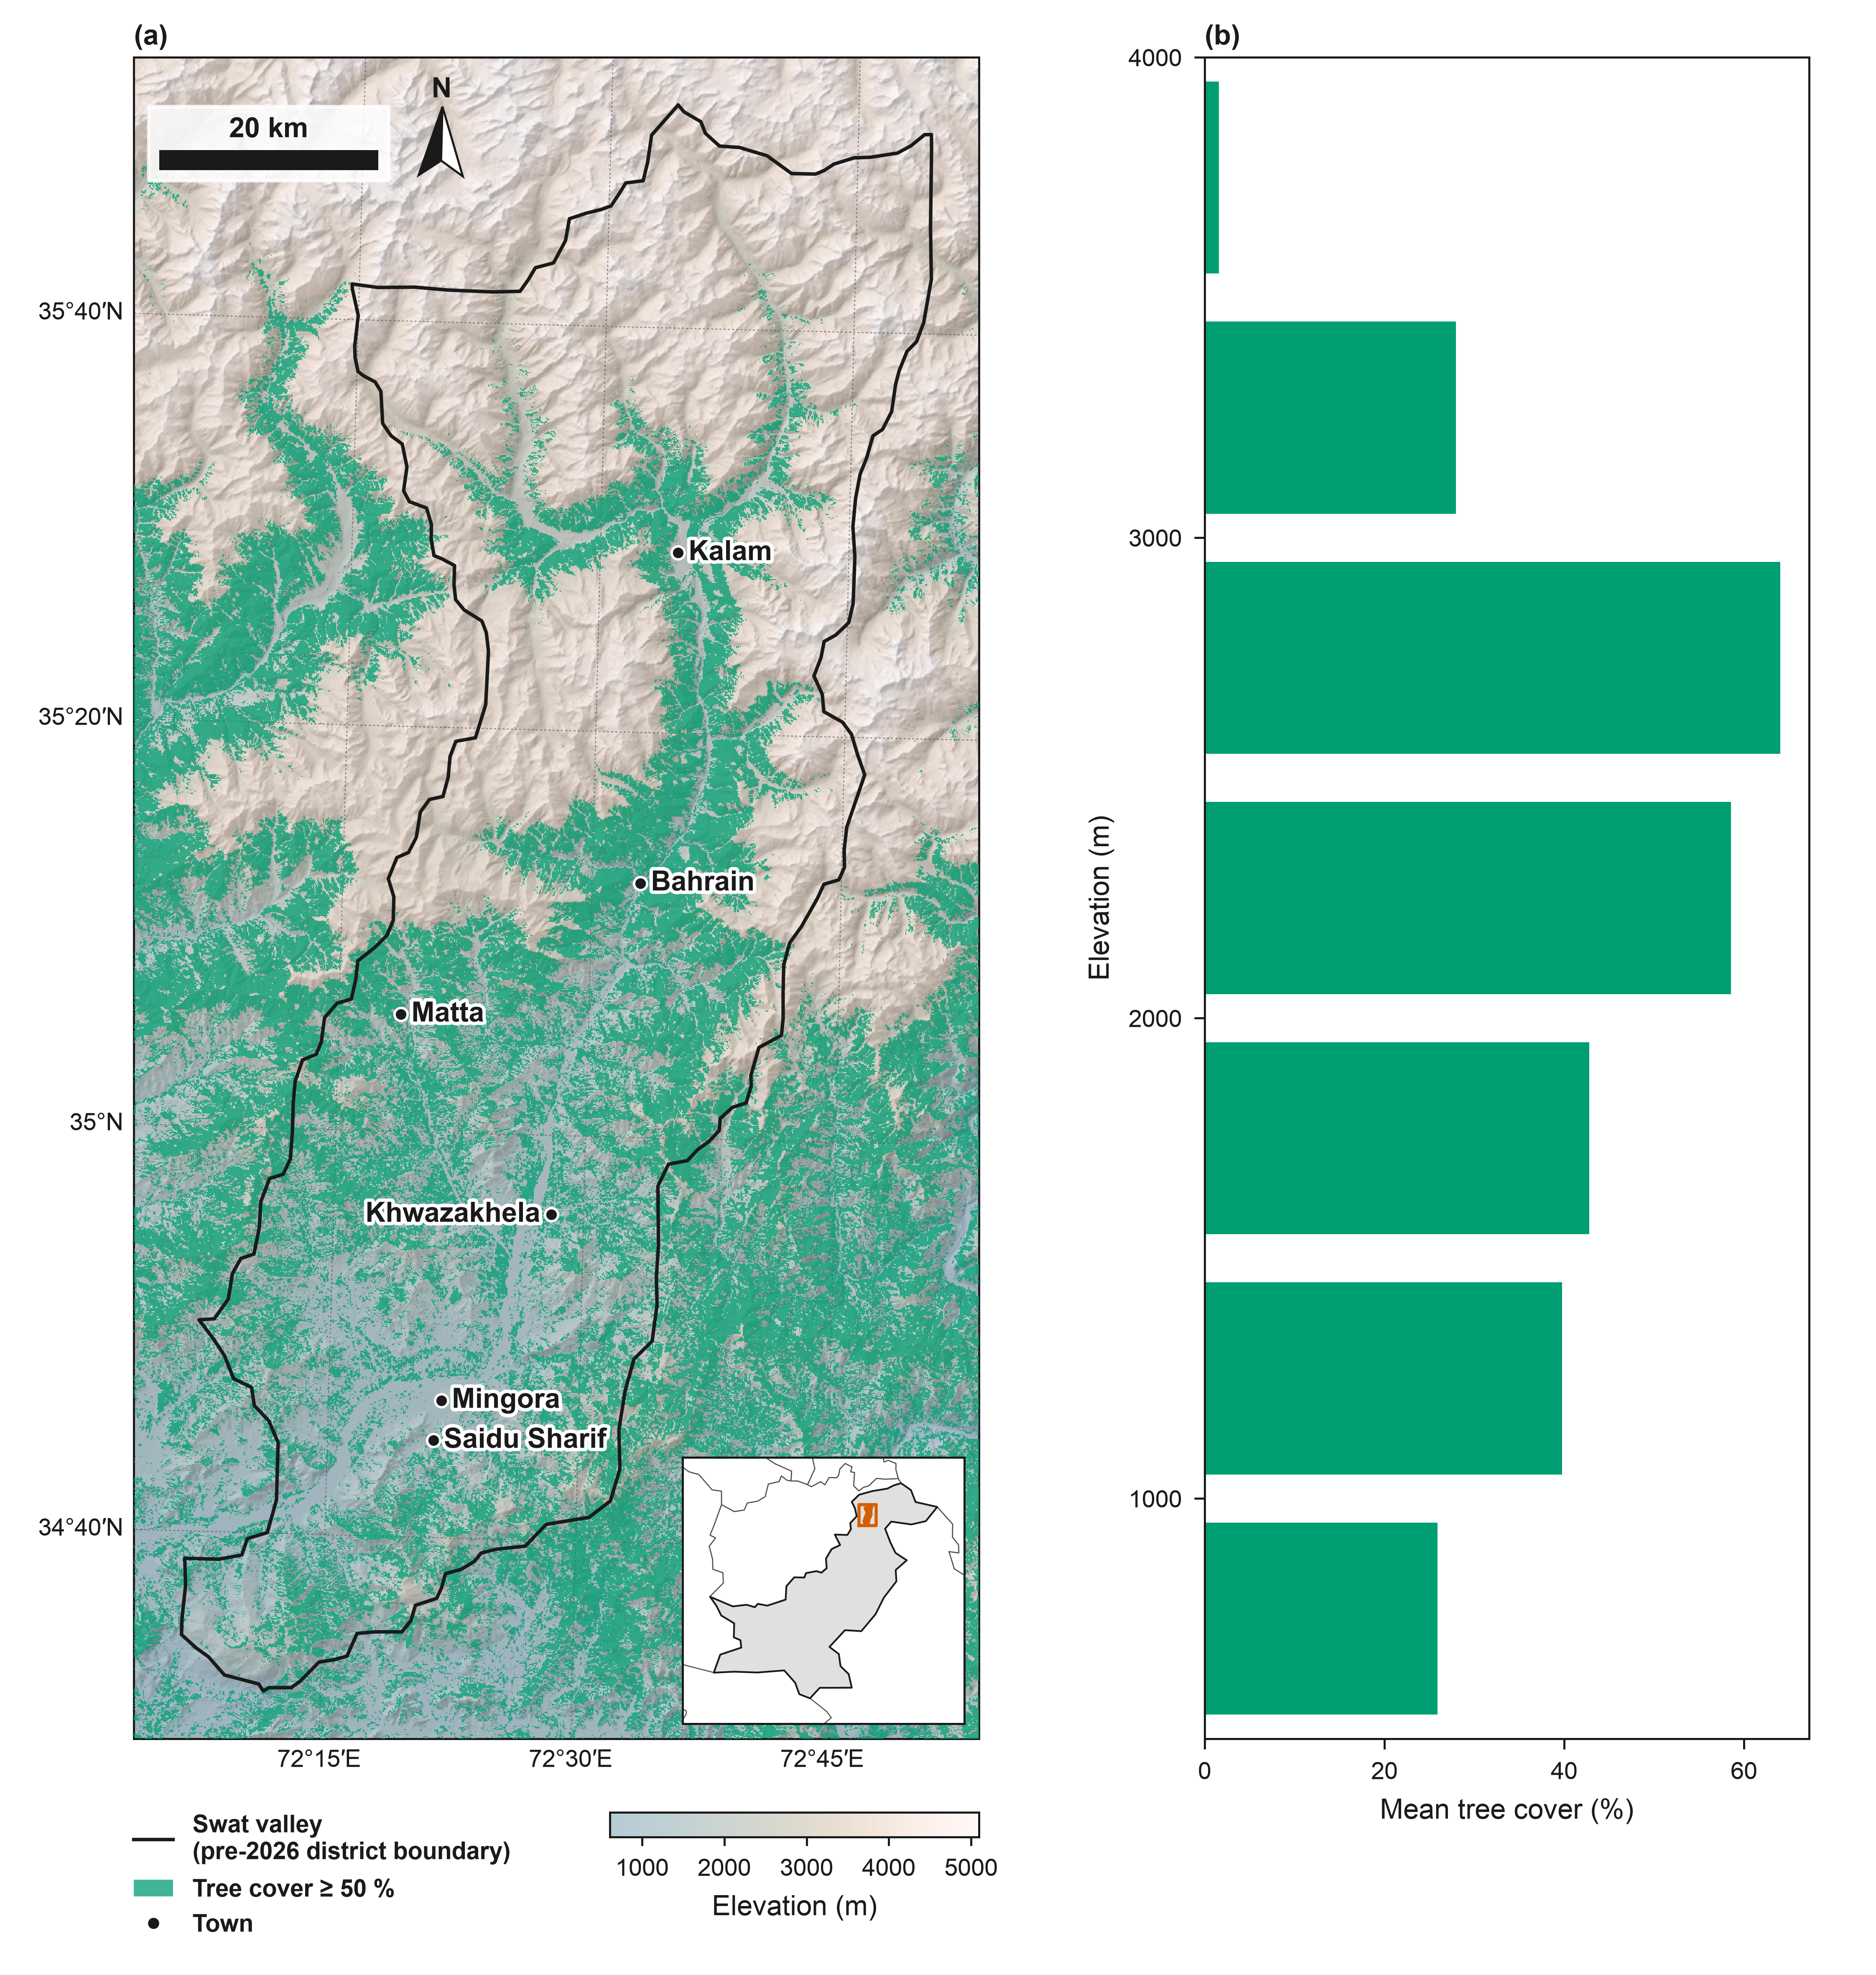
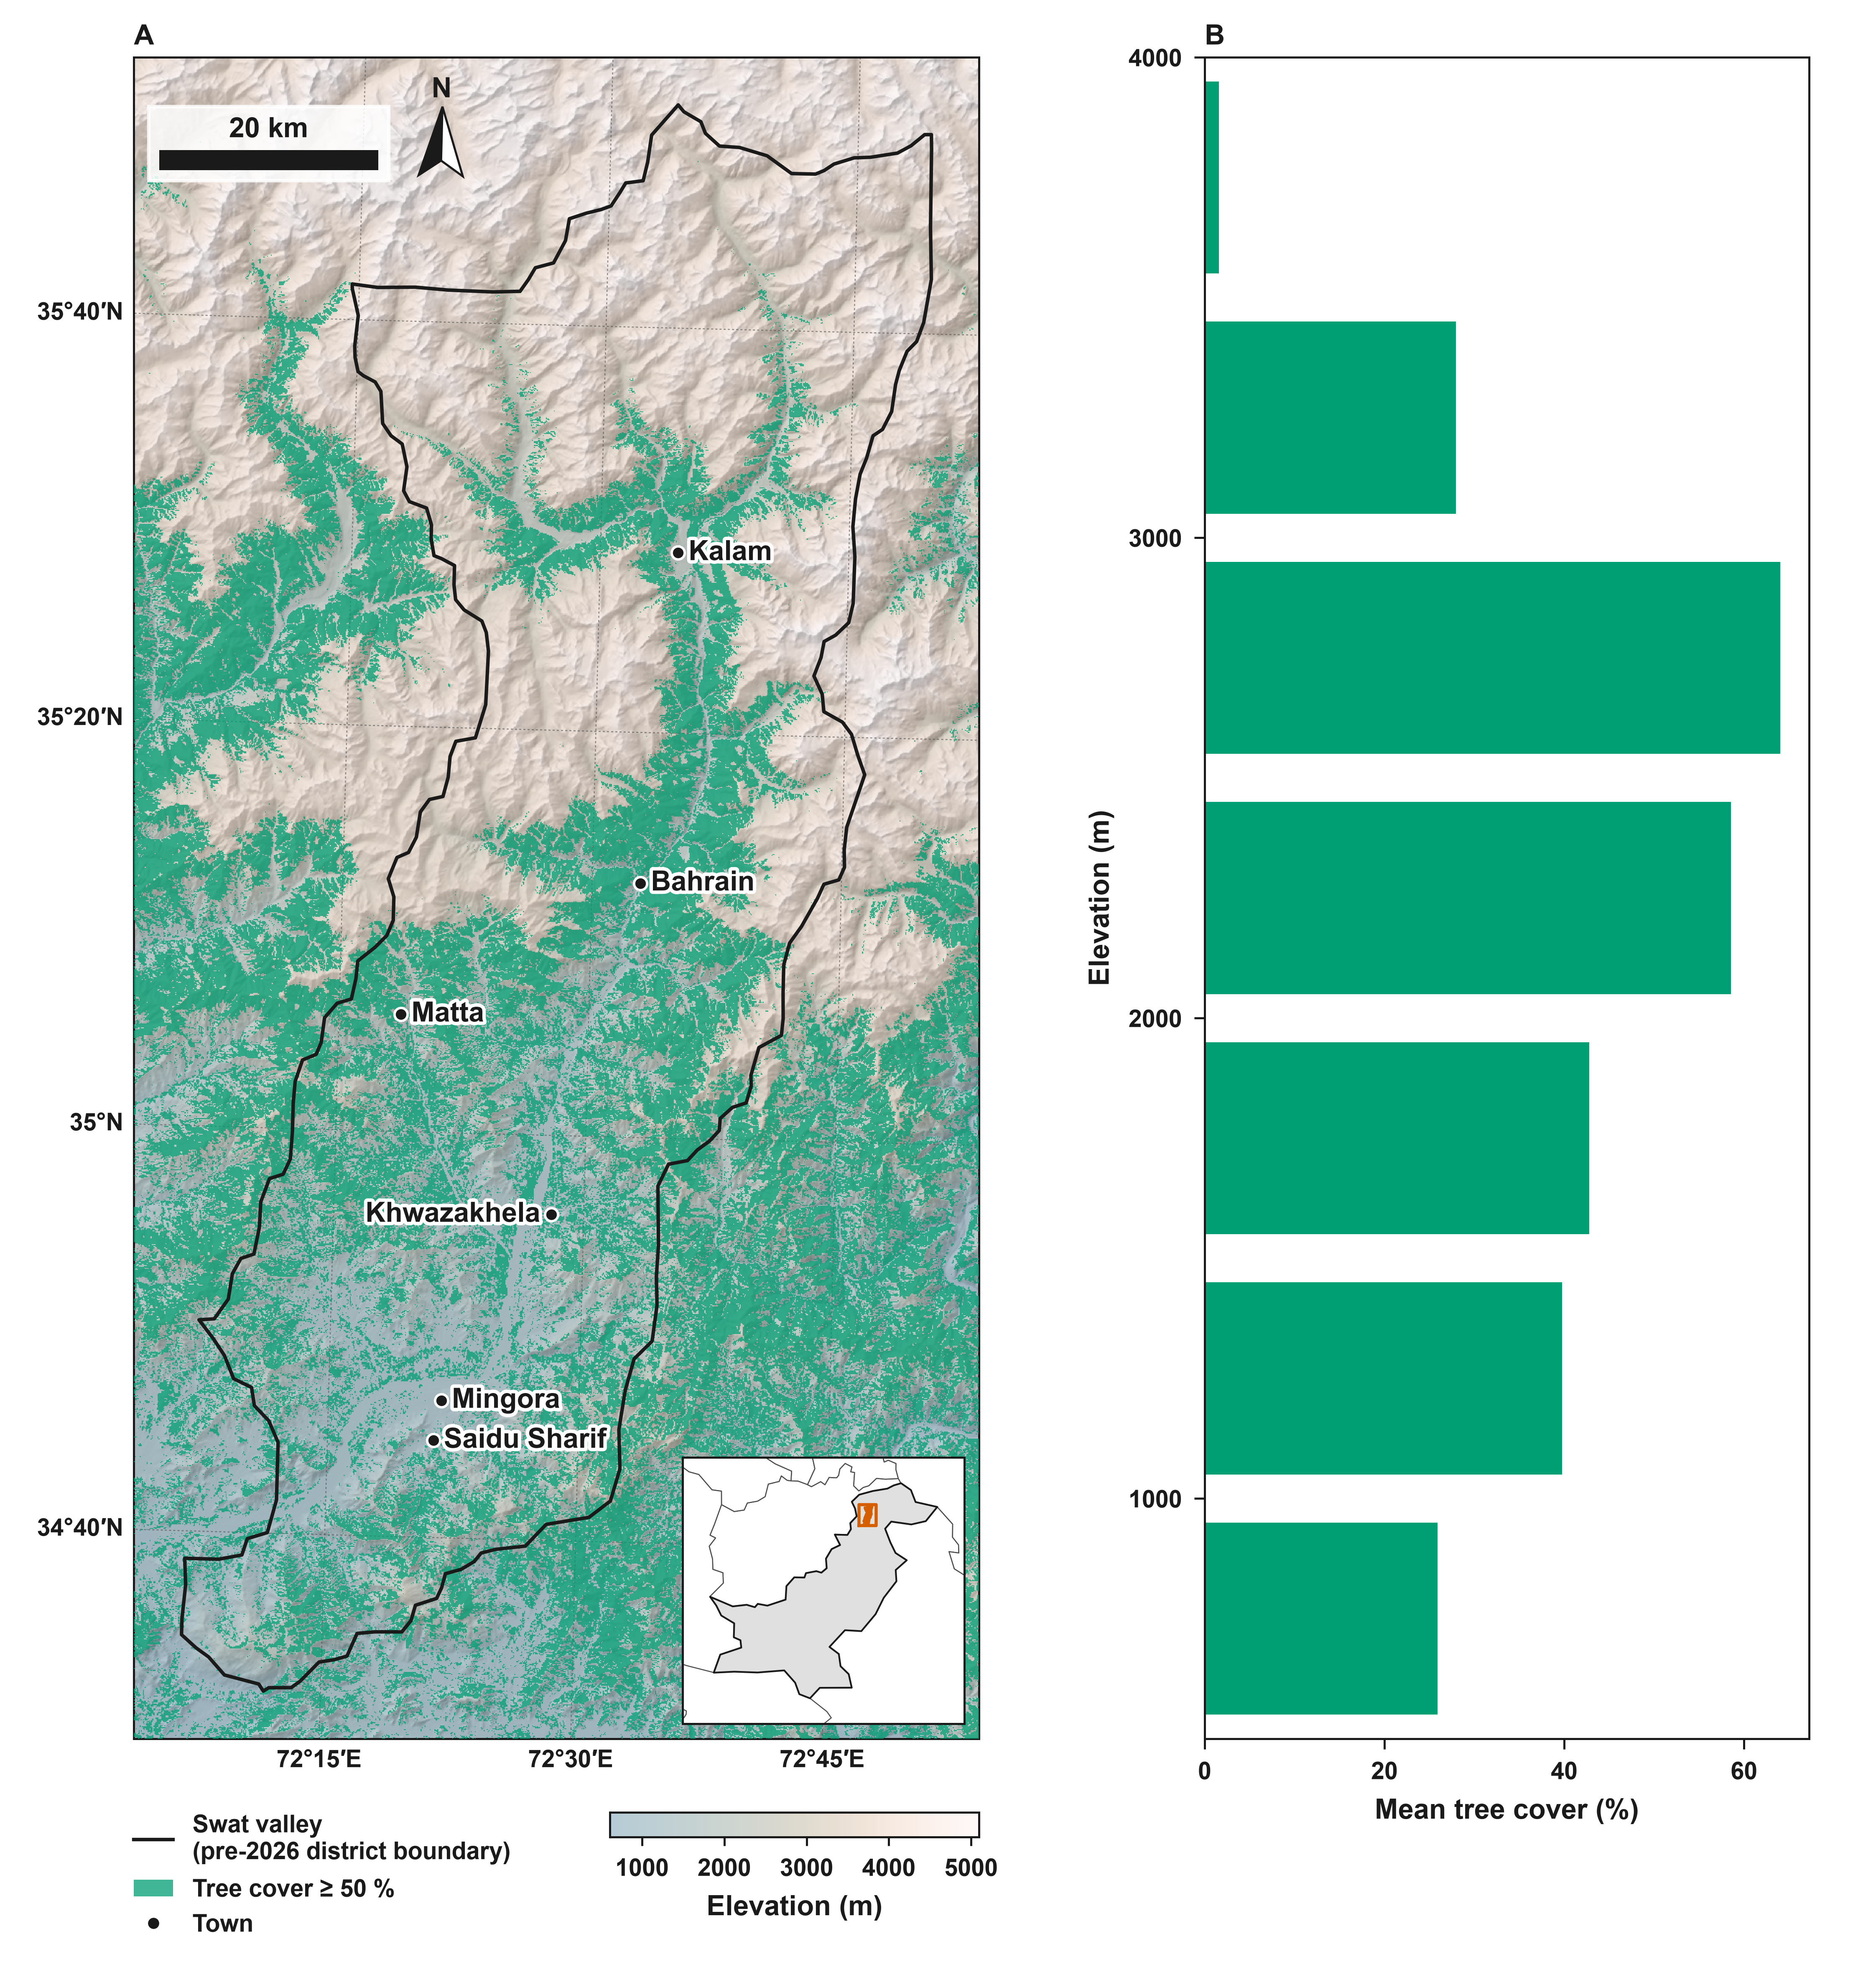
A two-panel figure drawn with the package defaults (Elsevier preset) and with an author's house style set in one call: set_style(journal="custom", font="Arial", bold=True, labels="A", max_ticks=5), which makes all text bold, adds bold capital panel letters and keeps at most five ticks per axis. (A) Swat valley (pre-2026 district boundary): the former Swat district (before January 2026), now Swat and Bar Swat (geoBoundaries), drawn into a subfigure with study_area_map(..., subfigure=...). (B) Mean tree cover inside the outline by 500 m elevation band, from the same 90 m rasters. Produced using Copernicus WorldDEM™-90 © DLR e.V. 2010-2014 and © Airbus Defence and Space GmbH 2014-2018 provided under COPERNICUS by the European Union and ESA; all rights reserved. © ESA WorldCover project 2021 / Contains modified Copernicus Sentinel data (2021) processed by ESA WorldCover consortium. Towns: GeoNames (CC BY 4.0). Locator inset: Natural Earth (default worldview). Boundaries and names shown do not imply any opinion on the legal status of any country or territory.
Script PDF (Package default) PNG, 600 dpi (Package default) PDF (House style in one call) PNG, 600 dpi (House style in one call)
from pathlib import Path

import geopandas as gpd
import numpy as np
import rioxarray

import eofigs

DATA = Path(__file__).resolve().parents[1] / "docs" / "data" / "swat"
BAND = 500  # m


def tree_cover_by_elevation():
    """Mean tree cover (%) inside the outline per elevation band.

    Bands cover at least 0.5 % of the area; the bands above the highest one with at least
    0.5 % mean tree cover are left out, so the axis ends where the forest does.
    """
    outline = gpd.read_file(DATA / "swat_boundary.geojson")
    dem = rioxarray.open_rasterio(DATA / "swat_dem_90m.tif", masked=True).squeeze()
    cover = rioxarray.open_rasterio(DATA / "swat_tree_cover_90m.tif", masked=True).squeeze()
    shapes = outline.to_crs(dem.rio.crs).geometry
    z = dem.rio.clip(shapes, drop=False).values.ravel()
    tc = cover.rio.clip(shapes, drop=False).values.ravel()
    keep = np.isfinite(z) & np.isfinite(tc)
    band = (z[keep] // BAND) * BAND
    lows = np.unique(band)
    counts = np.array([(band == b).sum() for b in lows])
    lows = lows[counts >= 0.005 * counts.sum()]  # bands with at least 0.5 % of the area
    means = np.array([tc[keep][band == b].mean() for b in lows])
    top = np.nonzero(means >= 0.5)[0].max() + 1  # end at the highest band with tree cover
    return lows[:top], means[:top]


def two_panels():
    """Draw (A) the study area map and (B) tree cover by elevation, in the current style."""
    fig, ax0 = eofigs.new_figure("double", height_mm=200, layout="none")
    ax0.remove()
    left, right = fig.subfigures(1, 2, width_ratios=[105, 85])
    eofigs.study_area_map(
        DATA / "swat_boundary.geojson",
        dem=DATA / "swat_dem_90m.tif",
        overlay=DATA / "swat_tree_cover_90m.tif",
        points=DATA / "swat_towns.geojson",
        aoi_label="Swat valley\n(pre-2026 district boundary)",
        overlay_label="Tree cover ≥ 50 %",
        points_label="Town",
        subfigure=left,
    )
    map_ax = left.axes[0]
    pos = map_ax.get_position()  # align panel B with the map frame
    chart = right.add_axes((0.2, pos.y0, 0.72, pos.height))
    lows, means = tree_cover_by_elevation()
    chart.barh(lows + BAND / 2, means, height=0.8 * BAND, color=eofigs.maps.OVERLAY_COLOUR)
    chart.set_ylim(lows[0], lows[-1] + BAND)
    chart.set_xlim(0, None)
    chart.set_xlabel("Mean tree cover (%)")
    chart.set_ylabel("Elevation (m)")
    eofigs.tidy_axes(chart)
    eofigs.label_panels([map_ax, chart])
    return fig


with eofigs.style("elsevier"):
    default = two_panels()

with eofigs.style(journal="custom", font="Arial", bold=True, labels="A", max_ticks=5):
    house = two_panels()

figures = {"Package default": default, "House style in one call": house}


# README card: both panels of the house-style figure, with their bold letters, the legend and
# the colour bar
readme_card = [*house.axes, *house.subfigs[0].legends]

if __name__ == "__main__":
    eofigs.save_figure(default, "swat_default")
    eofigs.save_figure(house, "swat_house_style")
Figure check (Package default)
Figure check (elsevier): passed
  PASS  size: 190.0 x 200.0 mm (double width).
  PASS  resolution: 600 dpi (at least 500 for figures with text and images).
  PASS  font size: Smallest text 7 pt (minimum 7 pt).
  PASS  fonts: Fonts in use: Arial.
  PASS  colour-blind safety: 4 categorical colours, all distinguishable.
  PASS  colour maps: Colour maps: gray (sequential), lapaz_light (sequential).
  PASS  overlay contrast: Overlay distinguishable from the colour map (min dE00 normal 23.5, protan 12.9, deutan 14.2, tritan 17.5).
Figure check (House style in one call)
Figure check (custom): passed
  PASS  size: 190.0 x 200.0 mm (double width).
  PASS  resolution: 600 dpi (at least 600 for figures with text and images).
  PASS  font size: Smallest text 7 pt (minimum 7 pt).
  PASS  fonts: Fonts in use: Arial.
  PASS  colour-blind safety: 4 categorical colours, all distinguishable.
  PASS  colour maps: Colour maps: gray (sequential), lapaz_light (sequential).
  PASS  overlay contrast: Overlay distinguishable from the colour map (min dE00 normal 23.5, protan 12.9, deutan 14.2, tritan 17.5).
  PASS  ticks: At most 5 tick labels per axis.