Event composite with significance
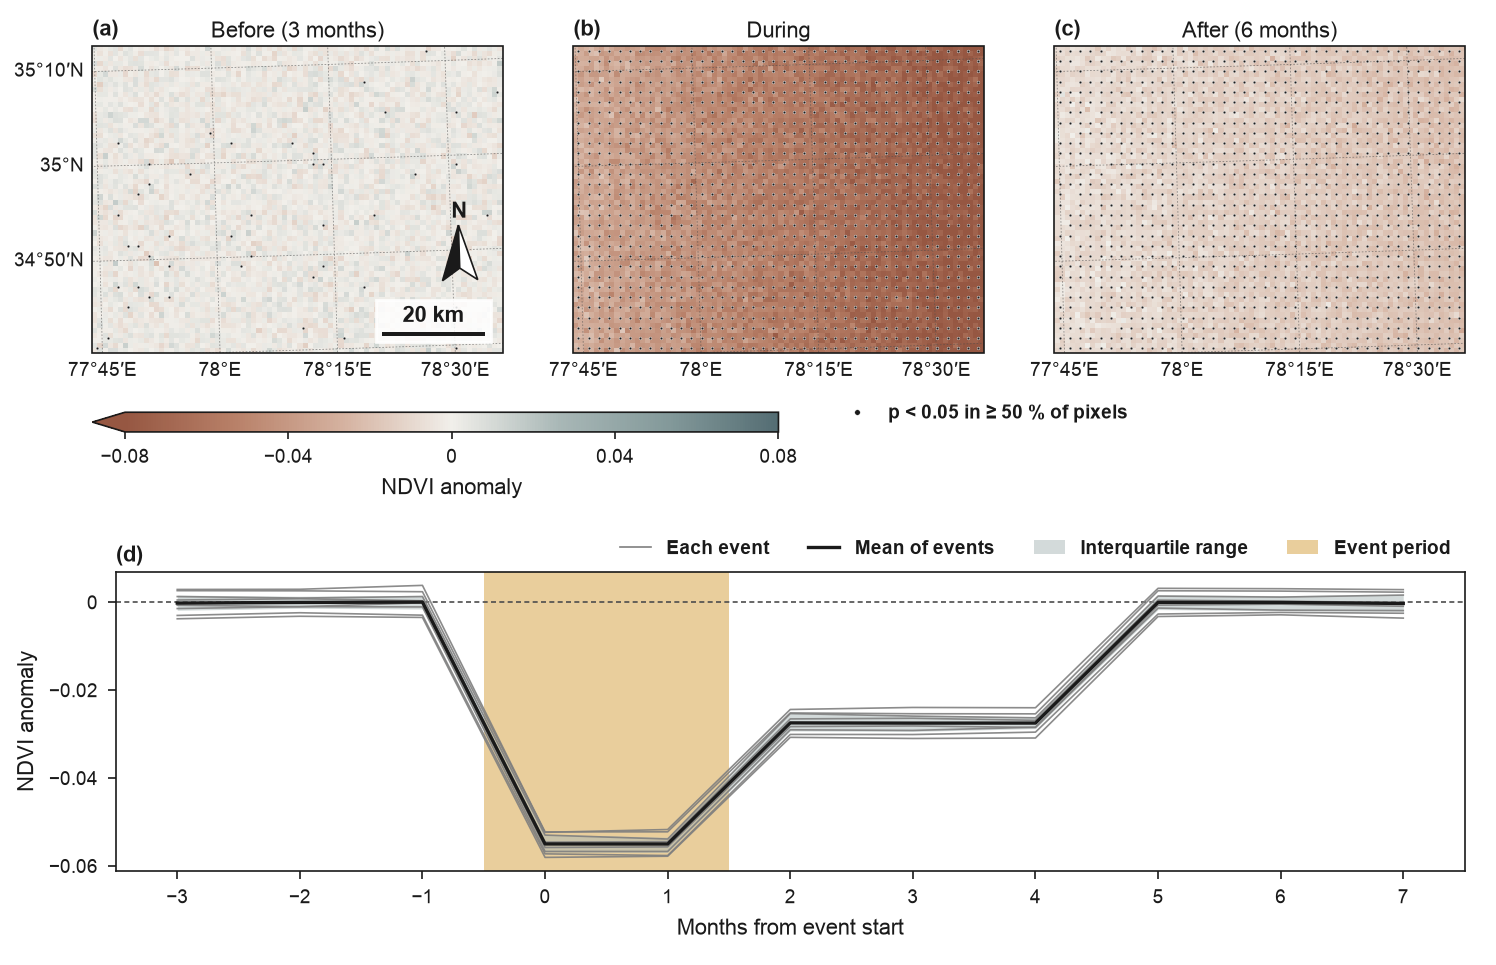
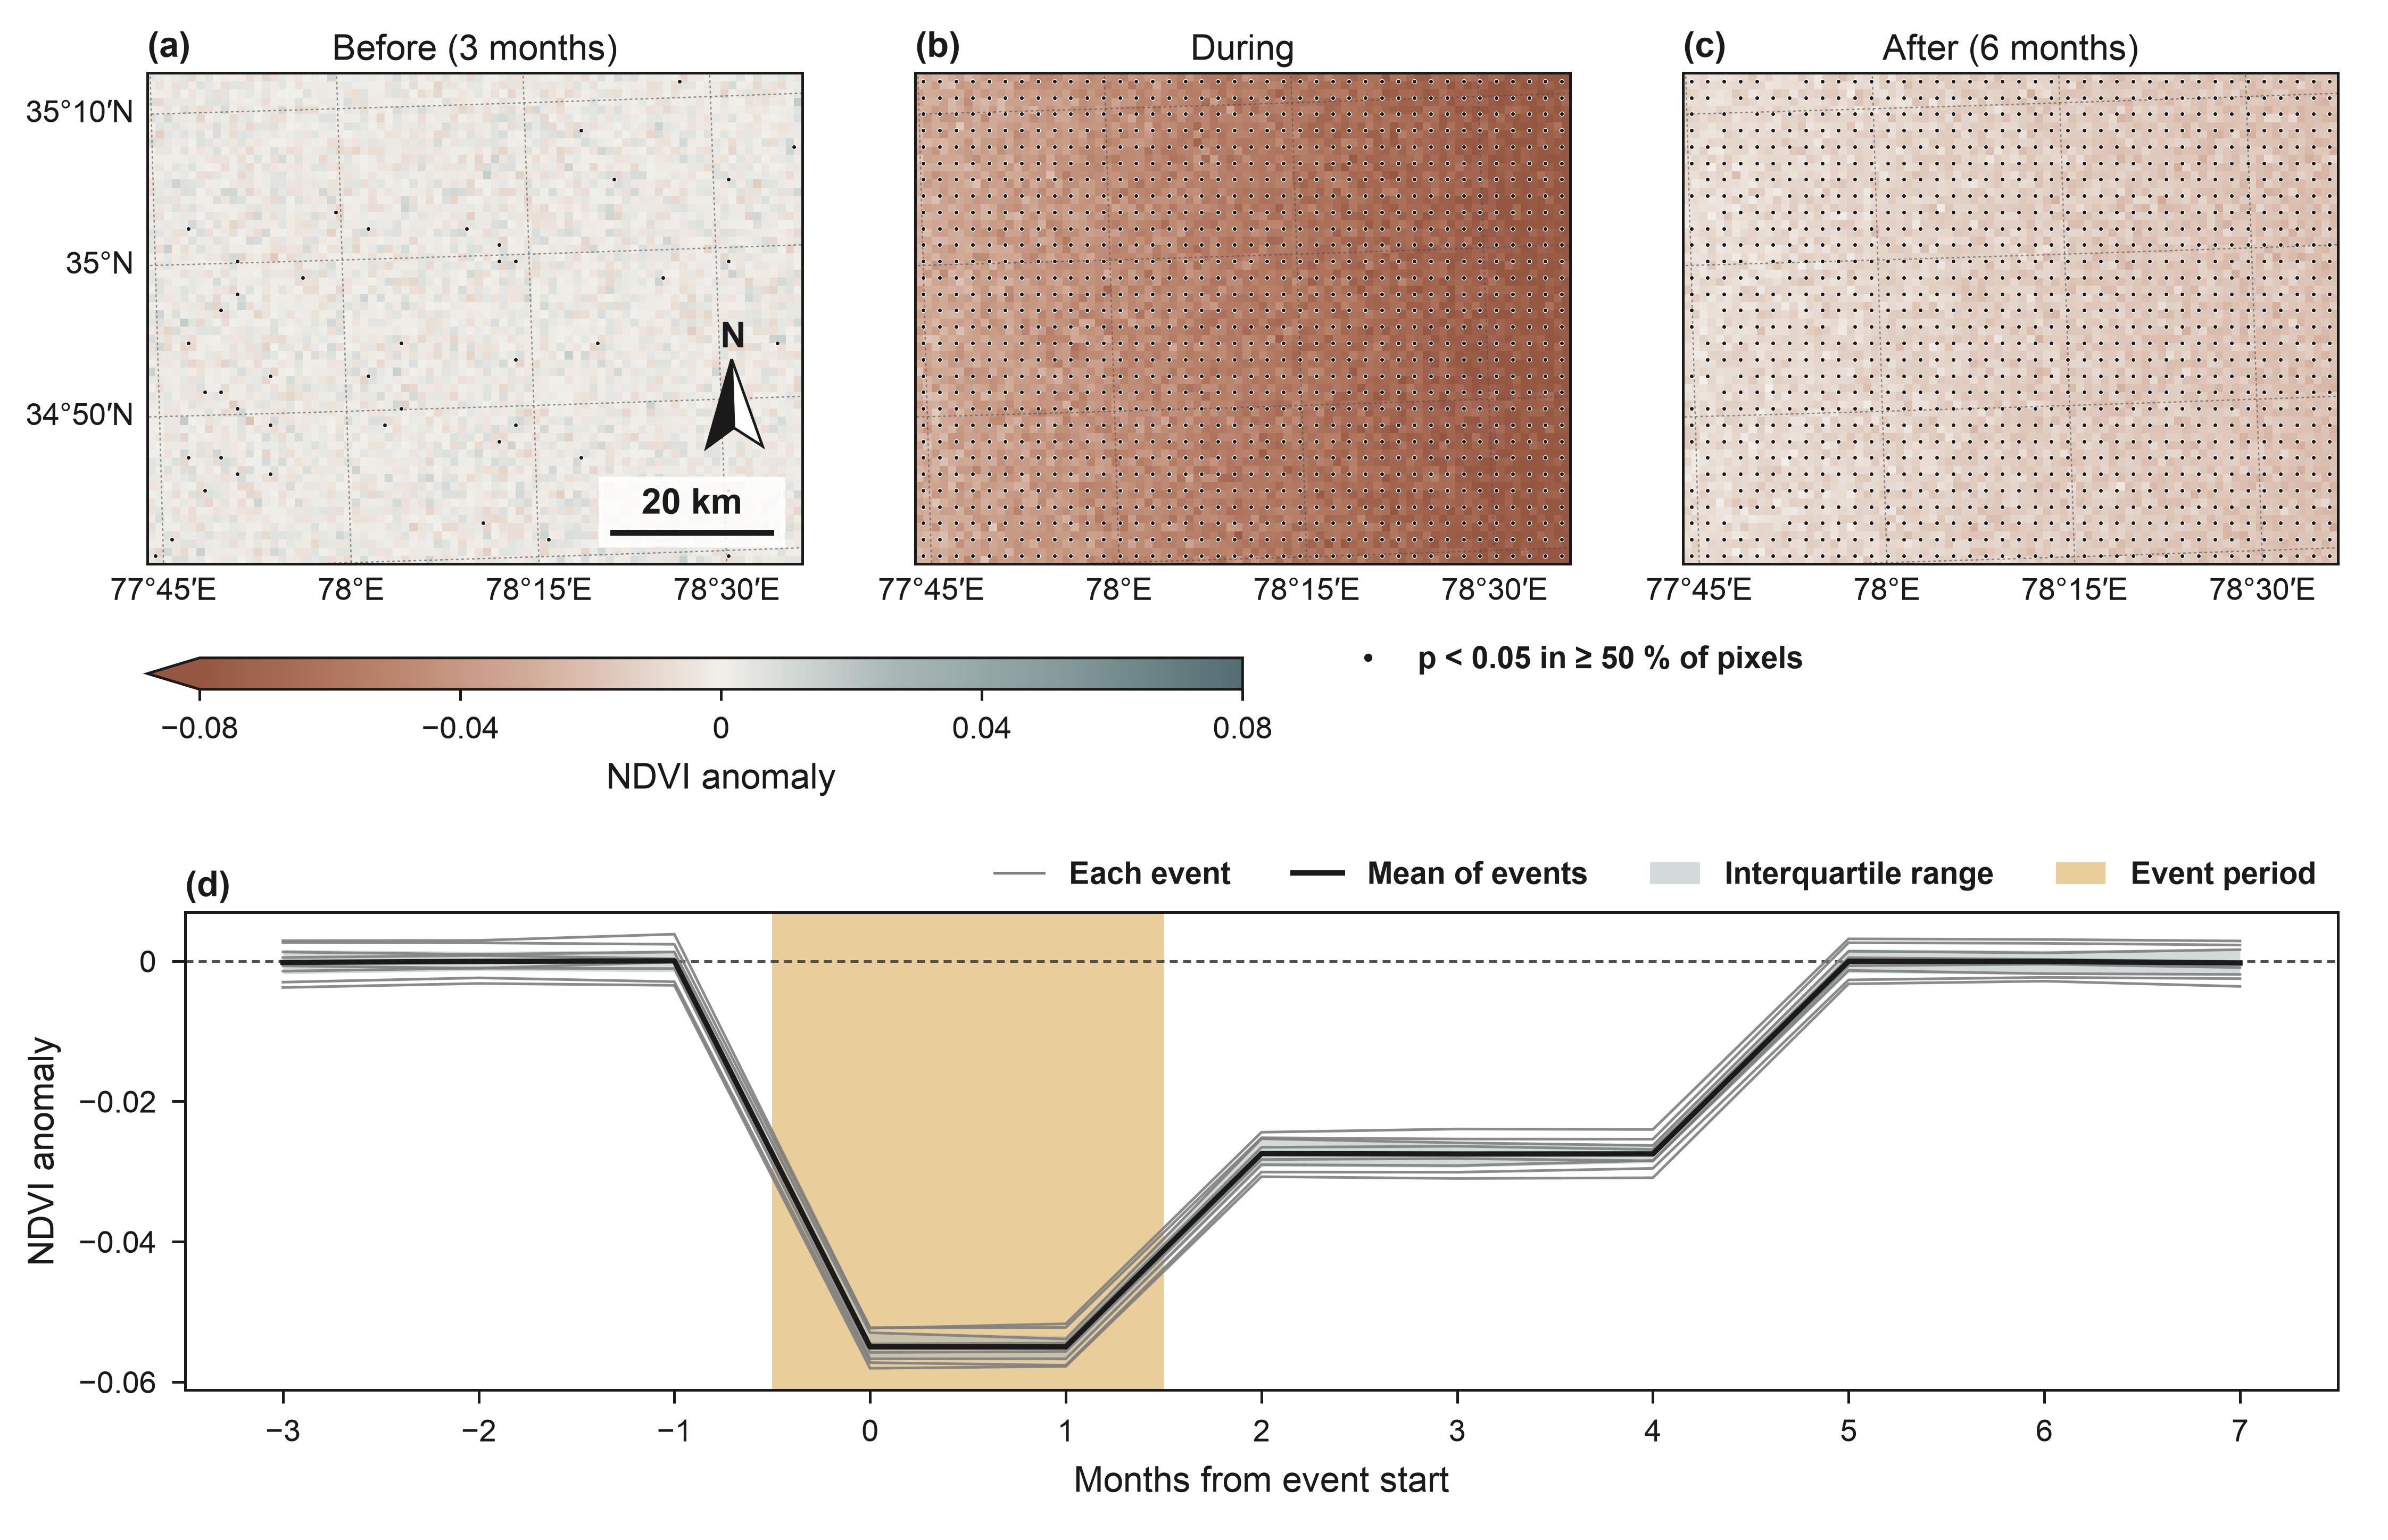
A synthetic monthly NDVI cube (2001–2020, 60 × 80 pixels of 1 km) with a seasonal cycle, a greening trend of 0.05 per decade, noise, and eight two-month hot-dry events. During each event NDVI drops by 0.03 in the west to 0.08 in the east, and by half that in the three months after. With eight events the t-test across events marks the response: dots where at least half of the pixels in a 1.6 mm cell are significant (p < 0.05); the per-pixel tests are not adjusted for multiple comparisons. The per-pixel linear trend is removed before the monthly climatology, so the late events are not made to look milder by the greening. Synthetic data.
import numpy as np
import pandas as pd
import rioxarray  # noqa: F401  (adds the .rio accessor)
import xarray as xr

import eofigs

rng = np.random.default_rng(3)
time = pd.date_range("2001-01-01", "2020-12-01", freq="MS")
ny, nx = 60, 80
years = (time - time[0]).days.to_numpy() / 365.2425
season = 0.15 * np.sin(2 * np.pi * (time.month.to_numpy() - 4) / 12)
east = np.linspace(0, 1, nx)[None, :] * np.ones((ny, 1))
values = (
    0.45
    + season[:, None, None]
    + 0.005 * years[:, None, None]
    + rng.normal(0, 0.02, (time.size, ny, nx))
)
starts = ["2002-06", "2004-07", "2007-05", "2009-08", "2012-06", "2014-07", "2017-06", "2019-05"]
events = []
for start in starts:
    i = time.get_loc(pd.Timestamp(f"{start}-01"))
    values[i : i + 2] -= 0.03 + 0.05 * east
    values[i + 2 : i + 5] -= 0.5 * (0.03 + 0.05 * east)
    events.append((time[i], time[i + 1]))
cube = xr.DataArray(
    values,
    dims=("time", "y", "x"),
    coords={
        "time": time,
        "y": 3_900_000 - (np.arange(ny) + 0.5) * 1000,
        "x": 750_000 + (np.arange(nx) + 0.5) * 1000,
    },
    name="ndvi",
    attrs={"long_name": "NDVI", "units": "1"},
).rio.write_crs("EPSG:32643")

eofigs.set_style("elsevier")
fig = eofigs.event_composite(cube, events, event_rule="eight synthetic two-month events")

if __name__ == "__main__":
    print(fig.eofigs_layout["caption"])
    print(eofigs.save_figure(fig, "event_composite_synthetic"))
Figure check
Figure check (elsevier): passed
  PASS  size: 190.0 x 122.6 mm (double width).
  PASS  resolution: 600 dpi (at least 500 for figures with text and images).
  PASS  font size: Smallest text 7 pt (minimum 7 pt).
  PASS  fonts: Fonts in use: Arial.
  PASS  colour-blind safety: 5 categorical colours, all distinguishable.
  PASS  colour maps: Colour maps: eofigs.terra_slate (diverging).