Accuracy scatter: calibration and validation plots
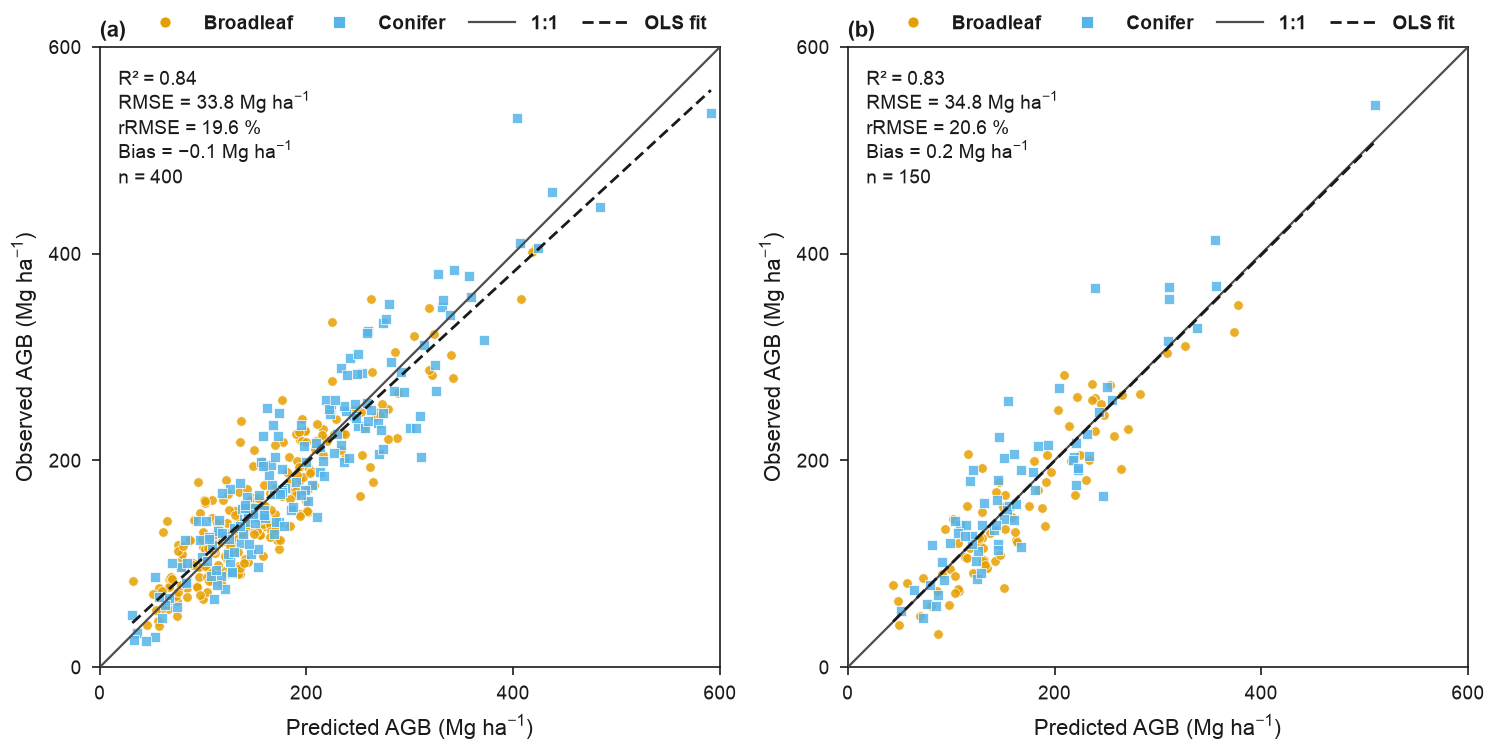
Synthetic aboveground biomass (AGB) for 400 calibration and 150 independent validation plots in two forest types, predicted by a model that overestimates low biomass and underestimates high biomass slightly. Each panel is one accuracy_scatter(..., ax=...) call: predicted AGB on the x axis and observed AGB on the y axis, with the 1:1 line and the least-squares line of observed on predicted (Piñeiro et al. 2008), whose slope and intercept describe the model's consistency and bias. Colours and markers separate the forest types; the statistics of each type are in the caption sentence from ax.eofigs_layout["caption"]. Synthetic data.
import numpy as np
import pandas as pd

import eofigs


def plots(n, seed):
    """Observed and predicted AGB (Mg ha⁻¹) and the forest type of n synthetic plots."""
    rng = np.random.default_rng(seed)
    kind = pd.Series(np.where(rng.random(n) < 0.55, "Broadleaf", "Conifer"), name="forest type")
    observed = np.where(kind == "Broadleaf", rng.gamma(5, 32, n), rng.gamma(4, 48, n))
    predicted = 20 + 0.88 * observed + rng.normal(0, 0.12 * observed + 12)
    return observed, np.clip(predicted, 0, None), kind


eofigs.set_style("elsevier")
fig, axes = eofigs.new_figure("double", ncols=2, height_mm=95)
for ax, (n, seed), label in zip(axes, [(400, 1), (150, 2)], ["(a)", "(b)"], strict=True):
    observed, predicted, kind = plots(n, seed)
    eofigs.accuracy_scatter(
        observed, predicted, variable="agb", groups=kind, ax=ax, labels=[label],
        stats=("r2", "rmse", "rrmse", "bias", "n"), limits=(0, 600),
    )  # fmt: skip

if __name__ == "__main__":
    for ax, name in zip(axes, ["Calibration", "Validation"], strict=True):
        print(name, ax.eofigs_layout["caption"])
    print(eofigs.save_figure(fig, "accuracy_scatter_synthetic"))
Figure check
Figure check (elsevier): passed
  PASS  size: 190.0 x 95.0 mm (double width).
  PASS  resolution: 600 dpi (at least 500 for figures with text and images).
  PASS  font size: Smallest text 7 pt (minimum 7 pt).
  PASS  fonts: Fonts in use: Arial.
  PASS  colour-blind safety: 4 categorical colours, all distinguishable.
  PASS  colour maps: No colour-mapped data.